Modeling drawdowns and drawups in financial markets - Risk.net
Modeling drawdowns and drawups in financial markets - Risk.net
Modeling drawdowns and drawups in financial markets - Risk.net

You also want an ePaper? Increase the reach of your titles
YUMPU automatically turns print PDFs into web optimized ePapers that Google loves.
66<br />
Beatriz Vaz de Melo Mendes <strong>and</strong> V<strong>in</strong>icius Ratton Br<strong>and</strong>i<br />
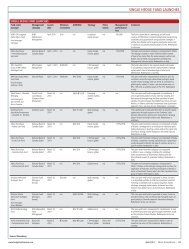
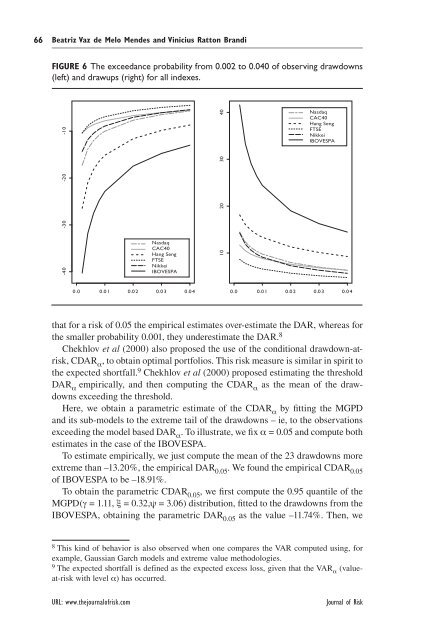
FIGURE 6 The exceedance probability from 0.002 to 0.040 of observ<strong>in</strong>g <strong>drawdowns</strong><br />
(left) <strong>and</strong> <strong>drawups</strong> (right) for all <strong>in</strong>dexes.<br />
-40 -30 -20 -10<br />
Nasdaq<br />
CAC40<br />
Hang Seng<br />
FTSE<br />
Nikkei<br />
IBOVESPA<br />
0.0 0.01 0.02 0.03 0.04<br />
0.0 0.01 0.02 0.03 0.04<br />
that for a risk of 0.05 the empirical estimates over-estimate the DAR, whereas for<br />
the smaller probability 0.001, they underestimate the DAR. 8<br />
Chekhlov et al (2000) also proposed the use of the conditional drawdown-atrisk,<br />
CDAR α , to obta<strong>in</strong> optimal portfolios. This risk measure is similar <strong>in</strong> spirit to<br />
the expected shortfall. 9 Chekhlov et al (2000) proposed estimat<strong>in</strong>g the threshold<br />
DAR α empirically, <strong>and</strong> then comput<strong>in</strong>g the CDAR α as the mean of the <strong>drawdowns</strong><br />
exceed<strong>in</strong>g the threshold.<br />
Here, we obta<strong>in</strong> a parametric estimate of the CDAR α by fitt<strong>in</strong>g the MGPD<br />
<strong>and</strong> its sub-models to the extreme tail of the <strong>drawdowns</strong> – ie, to the observations<br />
exceed<strong>in</strong>g the model based DAR α . To illustrate, we fix α = 0.05 <strong>and</strong> compute both<br />
estimates <strong>in</strong> the case of the IBOVESPA.<br />
To estimate empirically, we just compute the mean of the 23 <strong>drawdowns</strong> more<br />
extreme than –13.20%, the empirical DAR 0.05 . We found the empirical CDAR 0.05<br />
of IBOVESPA to be –18.91%.<br />
To obta<strong>in</strong> the parametric CDAR 0.05 , we first compute the 0.95 quantile of the<br />
MGPD(γ = 1.11, ξ = 0.32,ψ = 3.06) distribution, fitted to the <strong>drawdowns</strong> from the<br />
IBOVESPA, obta<strong>in</strong><strong>in</strong>g the parametric DAR 0.05 as the value –11.74%. Then, we<br />
URL: www.thejournalofrisk.com Journal of <strong>Risk</strong><br />
10 20 30 40<br />
Nasdaq<br />
CAC40<br />
Hang Seng<br />
FTSE<br />
Nikkei<br />
IBOVESPA<br />
8 This k<strong>in</strong>d of behavior is also observed when one compares the VAR computed us<strong>in</strong>g, for<br />
example, Gaussian Garch models <strong>and</strong> extreme value methodologies.<br />
9 The expected shortfall is def<strong>in</strong>ed as the expected excess loss, given that the VARα (valueat-risk<br />
with level α) has occurred.