Guinness Peat Group plc
Notes to Financial Statements - Guinness Peat Group plc
Notes to Financial Statements - Guinness Peat Group plc

Create successful ePaper yourself
Turn your PDF publications into a flip-book with our unique Google optimized e-Paper software.
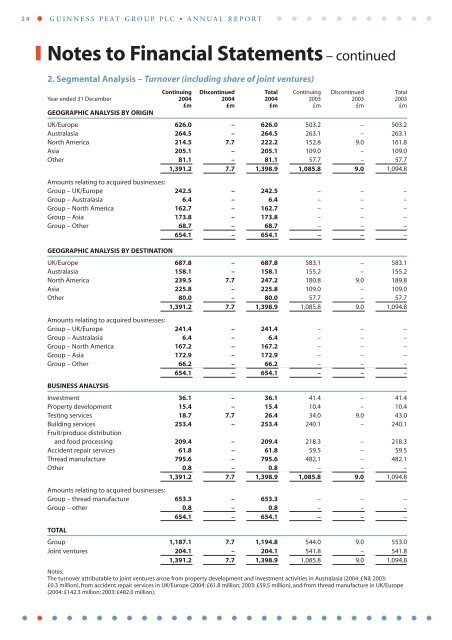
24 GUINNESS PEAT GROUP PLC • ANNUAL REPORTNotes to Financial Statements – continued2. Segmental Analysis – Turnover (including share of joint ventures)Continuing Discontinued Total Continuing Discontinued TotalYear ended 31 December 2004 2004 2004 2003 2003 2003£m £m £m £m £m £mGEOGRAPHIC ANALYSIS BY ORIGINUK/Europe 626.0 – 626.0 503.2 – 503.2Australasia 264.5 – 264.5 263.1 – 263.1North America 214.5 7.7 222.2 152.8 9.0 161.8Asia 205.1 – 205.1 109.0 – 109.0Other 81.1 – 81.1 57.7 – 57.71,391.2 7.7 1,398.9 1,085.8 9.0 1,094.8Amounts relating to acquired businesses:<strong>Group</strong> – UK/Europe 242.5 – 242.5 – – –<strong>Group</strong> – Australasia 6.4 – 6.4 – – –<strong>Group</strong> – North America 162.7 – 162.7 – – –<strong>Group</strong> – Asia 173.8 – 173.8 – – –<strong>Group</strong> – Other 68.7 – 68.7 – – –654.1 – 654.1 – – –GEOGRAPHIC ANALYSIS BY DESTINATIONUK/Europe 687.8 – 687.8 583.1 – 583.1Australasia 158.1 – 158.1 155.2 – 155.2North America 239.5 7.7 247.2 180.8 9.0 189.8Asia 225.8 – 225.8 109.0 – 109.0Other 80.0 – 80.0 57.7 – 57.71,391.2 7.7 1,398.9 1,085.8 9.0 1,094.8Amounts relating to acquired businesses:<strong>Group</strong> – UK/Europe 241.4 – 241.4 – – –<strong>Group</strong> – Australasia 6.4 – 6.4 – – –<strong>Group</strong> – North America 167.2 – 167.2 – – –<strong>Group</strong> – Asia 172.9 – 172.9 – – –<strong>Group</strong> – Other 66.2 – 66.2 – – –654.1 – 654.1 – – –BUSINESS ANALYSISInvestment 36.1 – 36.1 41.4 – 41.4Property development 15.4 – 15.4 10.4 – 10.4Testing services 18.7 7.7 26.4 34.0 9.0 43.0Building services 253.4 – 253.4 240.1 – 240.1Fruit/produce distributionand food processing 209.4 – 209.4 218.3 – 218.3Accident repair services 61.8 – 61.8 59.5 – 59.5Thread manufacture 795.6 – 795.6 482.1 – 482.1Other 0.8 – 0.8 – – –1,391.2 7.7 1,398.9 1,085.8 9.0 1,094.8Amounts relating to acquired businesses:<strong>Group</strong> – thread manufacture 653.3 – 653.3 – – –<strong>Group</strong> – other 0.8 – 0.8 – – –654.1 – 654.1 – – –TOTAL<strong>Group</strong> 1,187.1 7.7 1,194.8 544.0 9.0 553.0Joint ventures 204.1 – 204.1 541.8 – 541.81,391.2 7.7 1,398.9 1,085.8 9.0 1,094.8Notes:The turnover attributable to joint ventures arose from property development and investment activities in Australasia (2004: £Nil; 2003:£0.3 million), from accident repair services in UK/Europe (2004: £61.8 million; 2003: £59.5 million), and from thread manufacture in UK/Europe(2004: £142.3 million; 2003: £482.0 million).