Guinness Peat Group plc
Notes to Financial Statements - Guinness Peat Group plc
Notes to Financial Statements - Guinness Peat Group plc
You also want an ePaper? Increase the reach of your titles
YUMPU automatically turns print PDFs into web optimized ePapers that Google loves.
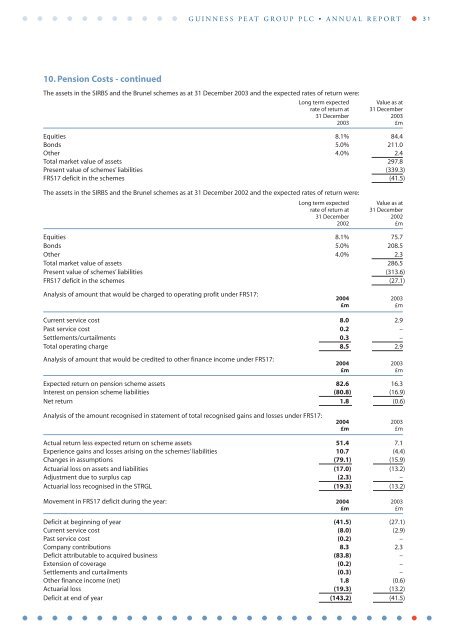
GUINNESS PEAT GROUP PLC • ANNUAL REPORT 3110. Pension Costs - continuedThe assets in the SIRBS and the Brunel schemes as at 31 December 2003 and the expected rates of return were:Long term expectedValue as atrate of return at 31 December31 December 20032003 £mEquities 8.1% 84.4Bonds 5.0% 211.0Other 4.0% 2.4Total market value of assets 297.8Present value of schemes’ liabilities (339.3)FRS17 deficit in the schemes (41.5)The assets in the SIRBS and the Brunel schemes as at 31 December 2002 and the expected rates of return were:Long term expectedValue as atrate of return at 31 December31 December 20022002 £mEquities 8.1% 75.7Bonds 5.0% 208.5Other 4.0% 2.3Total market value of assets 286.5Present value of schemes’ liabilities (313.6)FRS17 deficit in the schemes (27.1)Analysis of amount that would be charged to operating profit under FRS17:2004 2003£m £mCurrent service cost 8.0 2.9Past service cost 0.2 –Settlements/curtailments 0.3 –Total operating charge 8.5 2.9Analysis of amount that would be credited to other finance income under FRS17:2004 2003£m £mExpected return on pension scheme assets 82.6 16.3Interest on pension scheme liabilities (80.8) (16.9)Net return 1.8 (0.6)Analysis of the amount recognised in statement of total recognised gains and losses under FRS17:2004 2003£m £mActual return less expected return on scheme assets 51.4 7.1Experience gains and losses arising on the schemes’ liabilities 10.7 (4.4)Changes in assumptions (79.1) (15.9)Actuarial loss on assets and liabilities (17.0) (13.2)Adjustment due to surplus cap (2.3) –Actuarial loss recognised in the STRGL (19.3) (13.2)Movement in FRS17 deficit during the year: 2004 2003£m £mDeficit at beginning of year (41.5) (27.1)Current service cost (8.0) (2.9)Past service cost (0.2) –Company contributions 8.3 2.3Deficit attributable to acquired business (83.8) –Extension of coverage (0.2) –Settlements and curtailments (0.3) –Other finance income (net) 1.8 (0.6)Actuarial loss (19.3) (13.2)Deficit at end of year (143.2) (41.5)


