Ventura County - Alcohol and Drug Programs - State of California
Ventura County - Alcohol and Drug Programs - State of California
Ventura County - Alcohol and Drug Programs - State of California
- No tags were found...

Create successful ePaper yourself
Turn your PDF publications into a flip-book with our unique Google optimized e-Paper software.
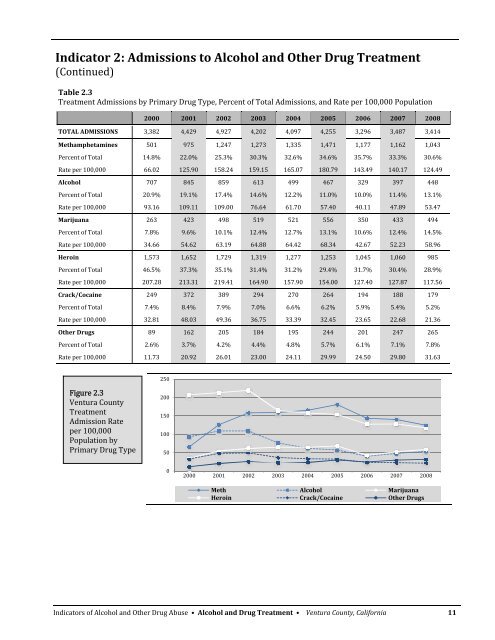
Indicator 2: Admissions to <strong>Alcohol</strong> <strong>and</strong> Other <strong>Drug</strong> Treatment(Continued)Table 2.3Treatment Admissions by Primary <strong>Drug</strong> Type, Percent <strong>of</strong> Total Admissions, <strong>and</strong> Rate per 100,000 Population2000 2001 2002 2003 2004 2005 2006 2007 2008TOTAL ADMISSIONS 3,382 4,429 4,927 4,202 4,097 4,255 3,296 3,487 3,414Methamphetamines 501 975 1,247 1,273 1,335 1,471 1,177 1,162 1,043Percent <strong>of</strong> Total 14.8% 22.0% 25.3% 30.3% 32.6% 34.6% 35.7% 33.3% 30.6%Rate per 100,000 66.02 125.90 158.24 159.15 165.07 180.79 143.49 140.17 124.49<strong>Alcohol</strong> 707 845 859 613 499 467 329 397 448Percent <strong>of</strong> Total 20.9% 19.1% 17.4% 14.6% 12.2% 11.0% 10.0% 11.4% 13.1%Rate per 100,000 93.16 109.11 109.00 76.64 61.70 57.40 40.11 47.89 53.47Marijuana 263 423 498 519 521 556 350 433 494Percent <strong>of</strong> Total 7.8% 9.6% 10.1% 12.4% 12.7% 13.1% 10.6% 12.4% 14.5%Rate per 100,000 34.66 54.62 63.19 64.88 64.42 68.34 42.67 52.23 58.96Heroin 1,573 1,652 1,729 1,319 1,277 1,253 1,045 1,060 985Percent <strong>of</strong> Total 46.5% 37.3% 35.1% 31.4% 31.2% 29.4% 31.7% 30.4% 28.9%Rate per 100,000 207.28 213.31 219.41 164.90 157.90 154.00 127.40 127.87 117.56Crack/Cocaine 249 372 389 294 270 264 194 188 179Percent <strong>of</strong> Total 7.4% 8.4% 7.9% 7.0% 6.6% 6.2% 5.9% 5.4% 5.2%Rate per 100,000 32.81 48.03 49.36 36.75 33.39 32.45 23.65 22.68 21.36Other <strong>Drug</strong>s 89 162 205 184 195 244 201 247 265Percent <strong>of</strong> Total 2.6% 3.7% 4.2% 4.4% 4.8% 5.7% 6.1% 7.1% 7.8%Rate per 100,000 11.73 20.92 26.01 23.00 24.11 29.99 24.50 29.80 31.63250Figure 2.3<strong>Ventura</strong> <strong>County</strong>TreatmentAdmission Rateper 100,000Population byPrimary <strong>Drug</strong> Type2001501005002000 2001 2002 2003 2004 2005 2006 2007 2008Meth <strong>Alcohol</strong> MarijuanaHeroin Crack/Cocaine Other <strong>Drug</strong>sIndicators <strong>of</strong> <strong>Alcohol</strong> <strong>and</strong> Other <strong>Drug</strong> Abuse • <strong>Alcohol</strong> <strong>and</strong> <strong>Drug</strong> Treatment • <strong>Ventura</strong> <strong>County</strong>, <strong>California</strong> 11