Ventura County - Alcohol and Drug Programs - State of California
Ventura County - Alcohol and Drug Programs - State of California
Ventura County - Alcohol and Drug Programs - State of California
- No tags were found...

Create successful ePaper yourself
Turn your PDF publications into a flip-book with our unique Google optimized e-Paper software.
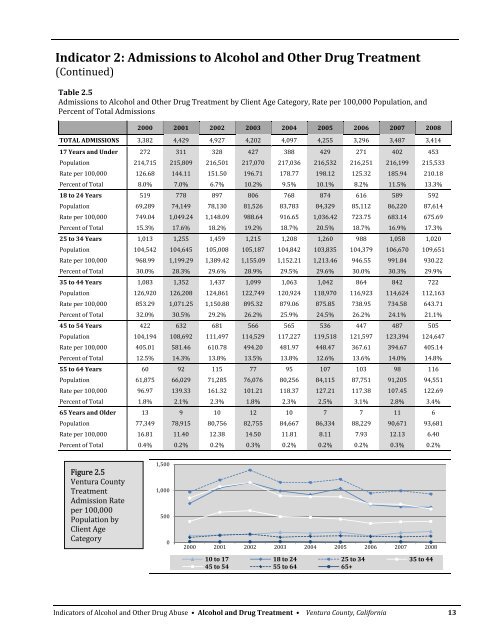
Indicator 2: Admissions to <strong>Alcohol</strong> <strong>and</strong> Other <strong>Drug</strong> Treatment(Continued)Table 2.5Admissions to <strong>Alcohol</strong> <strong>and</strong> Other <strong>Drug</strong> Treatment by Client Age Category, Rate per 100,000 Population, <strong>and</strong>Percent <strong>of</strong> Total Admissions2000 2001 2002 2003 2004 2005 2006 2007 2008TOTAL ADMISSIONS 3,382 4,429 4,927 4,202 4,097 4,255 3,296 3,487 3,41417 Years <strong>and</strong> Under 272 311 328 427 388 429 271 402 453Population 214,715 215,809 216,501 217,070 217,036 216,532 216,251 216,199 215,533Rate per 100,000 126.68 144.11 151.50 196.71 178.77 198.12 125.32 185.94 210.18Percent <strong>of</strong> Total 8.0% 7.0% 6.7% 10.2% 9.5% 10.1% 8.2% 11.5% 13.3%18 to 24 Years 519 778 897 806 768 874 616 589 592Population 69,289 74,149 78,130 81,526 83,783 84,329 85,112 86,220 87,614Rate per 100,000 749.04 1,049.24 1,148.09 988.64 916.65 1,036.42 723.75 683.14 675.69Percent <strong>of</strong> Total 15.3% 17.6% 18.2% 19.2% 18.7% 20.5% 18.7% 16.9% 17.3%25 to 34 Years 1,013 1,255 1,459 1,215 1,208 1,260 988 1,058 1,020Population 104,542 104,645 105,008 105,187 104,842 103,835 104,379 106,670 109,651Rate per 100,000 968.99 1,199.29 1,389.42 1,155.09 1,152.21 1,213.46 946.55 991.84 930.22Percent <strong>of</strong> Total 30.0% 28.3% 29.6% 28.9% 29.5% 29.6% 30.0% 30.3% 29.9%35 to 44 Years 1,083 1,352 1,437 1,099 1,063 1,042 864 842 722Population 126,920 126,208 124,861 122,749 120,924 118,970 116,923 114,624 112,163Rate per 100,000 853.29 1,071.25 1,150.88 895.32 879.06 875.85 738.95 734.58 643.71Percent <strong>of</strong> Total 32.0% 30.5% 29.2% 26.2% 25.9% 24.5% 26.2% 24.1% 21.1%45 to 54 Years 422 632 681 566 565 536 447 487 505Population 104,194 108,692 111,497 114,529 117,227 119,518 121,597 123,394 124,647Rate per 100,000 405.01 581.46 610.78 494.20 481.97 448.47 367.61 394.67 405.14Percent <strong>of</strong> Total 12.5% 14.3% 13.8% 13.5% 13.8% 12.6% 13.6% 14.0% 14.8%55 to 64 Years 60 92 115 77 95 107 103 98 116Population 61,875 66,029 71,285 76,076 80,256 84,115 87,751 91,205 94,551Rate per 100,000 96.97 139.33 161.32 101.21 118.37 127.21 117.38 107.45 122.69Percent <strong>of</strong> Total 1.8% 2.1% 2.3% 1.8% 2.3% 2.5% 3.1% 2.8% 3.4%65 Years <strong>and</strong> Older 13 9 10 12 10 7 7 11 6Population 77,349 78,915 80,756 82,755 84,667 86,334 88,229 90,671 93,681Rate per 100,000 16.81 11.40 12.38 14.50 11.81 8.11 7.93 12.13 6.40Percent <strong>of</strong> Total 0.4% 0.2% 0.2% 0.3% 0.2% 0.2% 0.2% 0.3% 0.2%Figure 2.5<strong>Ventura</strong> <strong>County</strong>TreatmentAdmission Rateper 100,000Population byClient AgeCategory1,5001,00050002000 2001 2002 2003 2004 2005 2006 2007 200810 to 17 18 to 24 25 to 34 35 to 4445 to 54 55 to 64 65+Indicators <strong>of</strong> <strong>Alcohol</strong> <strong>and</strong> Other <strong>Drug</strong> Abuse • <strong>Alcohol</strong> <strong>and</strong> <strong>Drug</strong> Treatment • <strong>Ventura</strong> <strong>County</strong>, <strong>California</strong> 13