Ventura County - Alcohol and Drug Programs - State of California
Ventura County - Alcohol and Drug Programs - State of California
Ventura County - Alcohol and Drug Programs - State of California
- No tags were found...

Create successful ePaper yourself
Turn your PDF publications into a flip-book with our unique Google optimized e-Paper software.
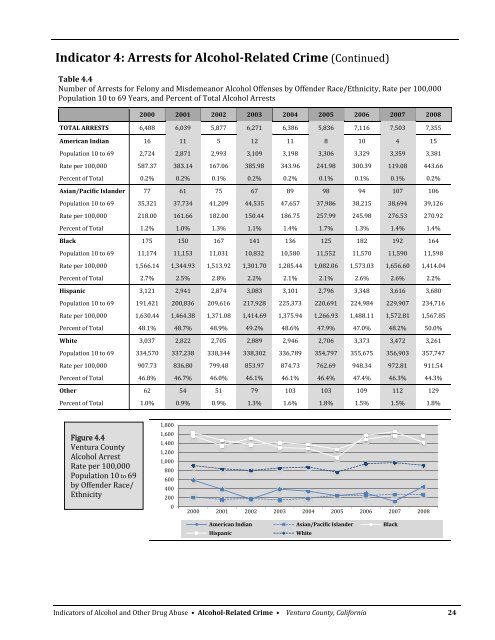
Indicator 4: Arrests for <strong>Alcohol</strong>Related Crime (Continued)Table 4.4Number <strong>of</strong> Arrests for Felony <strong>and</strong> Misdemeanor <strong>Alcohol</strong> Offenses by Offender Race/Ethnicity, Rate per 100,000Population 10 to 69 Years, <strong>and</strong> Percent <strong>of</strong> Total <strong>Alcohol</strong> Arrests2000 2001 2002 2003 2004 2005 2006 2007 2008TOTAL ARRESTS 6,488 6,039 5,877 6,271 6,386 5,836 7,116 7,503 7,355American Indian 16 11 5 12 11 8 10 4 15Population 10 to 69 2,724 2,871 2,993 3,109 3,198 3,306 3,329 3,359 3,381Rate per 100,000 587.37 383.14 167.06 385.98 343.96 241.98 300.39 119.08 443.66Percent <strong>of</strong> Total 0.2% 0.2% 0.1% 0.2% 0.2% 0.1% 0.1% 0.1% 0.2%Asian/Pacific Isl<strong>and</strong>er 77 61 75 67 89 98 94 107 106Population 10 to 69 35,321 37,734 41,209 44,535 47,657 37,986 38,215 38,694 39,126Rate per 100,000 218.00 161.66 182.00 150.44 186.75 257.99 245.98 276.53 270.92Percent <strong>of</strong> Total 1.2% 1.0% 1.3% 1.1% 1.4% 1.7% 1.3% 1.4% 1.4%Black 175 150 167 141 136 125 182 192 164Population 10 to 69 11,174 11,153 11,031 10,832 10,580 11,552 11,570 11,590 11,598Rate per 100,000 1,566.14 1,344.93 1,513.92 1,301.70 1,285.44 1,082.06 1,573.03 1,656.60 1,414.04Percent <strong>of</strong> Total 2.7% 2.5% 2.8% 2.2% 2.1% 2.1% 2.6% 2.6% 2.2%Hispanic 3,121 2,941 2,874 3,083 3,101 2,796 3,348 3,616 3,680Population 10 to 69 191,421 200,836 209,616 217,928 225,373 220,691 224,984 229,907 234,716Rate per 100,000 1,630.44 1,464.38 1,371.08 1,414.69 1,375.94 1,266.93 1,488.11 1,572.81 1,567.85Percent <strong>of</strong> Total 48.1% 48.7% 48.9% 49.2% 48.6% 47.9% 47.0% 48.2% 50.0%White 3,037 2,822 2,705 2,889 2,946 2,706 3,373 3,472 3,261Population 10 to 69 334,570 337,238 338,344 338,302 336,789 354,797 355,675 356,903 357,747Rate per 100,000 907.73 836.80 799.48 853.97 874.73 762.69 948.34 972.81 911.54Percent <strong>of</strong> Total 46.8% 46.7% 46.0% 46.1% 46.1% 46.4% 47.4% 46.3% 44.3%Other 62 54 51 79 103 103 109 112 129Percent <strong>of</strong> Total 1.0% 0.9% 0.9% 1.3% 1.6% 1.8% 1.5% 1.5% 1.8%Figure 4.4<strong>Ventura</strong> <strong>County</strong><strong>Alcohol</strong> ArrestRate per 100,000Population 10 to 69by Offender Race/Ethnicity1,8001,6001,4001,2001,00080060040020002000 2001 2002 2003 2004 2005 2006 2007 2008American Indian Asian/Pacific Isl<strong>and</strong>er BlackHispanicWhiteIndicators <strong>of</strong> <strong>Alcohol</strong> <strong>and</strong> Other <strong>Drug</strong> Abuse • <strong>Alcohol</strong>Related Crime • <strong>Ventura</strong> <strong>County</strong>, <strong>California</strong> 24