Ventura County - Alcohol and Drug Programs - State of California
Ventura County - Alcohol and Drug Programs - State of California
Ventura County - Alcohol and Drug Programs - State of California
- No tags were found...

You also want an ePaper? Increase the reach of your titles
YUMPU automatically turns print PDFs into web optimized ePapers that Google loves.
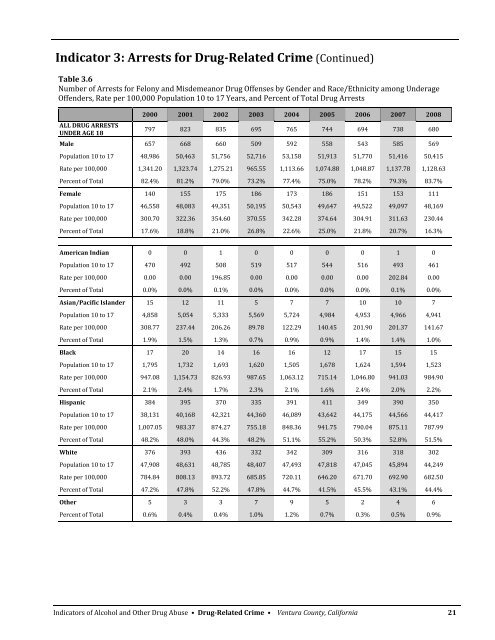
Indicator 3: Arrests for <strong>Drug</strong>Related Crime (Continued)Table 3.6Number <strong>of</strong> Arrests for Felony <strong>and</strong> Misdemeanor <strong>Drug</strong> Offenses by Gender <strong>and</strong> Race/Ethnicity among UnderageOffenders, Rate per 100,000 Population 10 to 17 Years, <strong>and</strong> Percent <strong>of</strong> Total <strong>Drug</strong> ArrestsALL DRUG ARRESTSUNDER AGE 182000 2001 2002 2003 2004 2005 2006 2007 2008797 823 835 695 765 744 694 738 680Male 657 668 660 509 592 558 543 585 569Population 10 to 17 48,986 50,463 51,756 52,716 53,158 51,913 51,770 51,416 50,415Rate per 100,000 1,341.20 1,323.74 1,275.21 965.55 1,113.66 1,074.88 1,048.87 1,137.78 1,128.63Percent <strong>of</strong> Total 82.4% 81.2% 79.0% 73.2% 77.4% 75.0% 78.2% 79.3% 83.7%Female 140 155 175 186 173 186 151 153 111Population 10 to 17 46,558 48,083 49,351 50,195 50,543 49,647 49,522 49,097 48,169Rate per 100,000 300.70 322.36 354.60 370.55 342.28 374.64 304.91 311.63 230.44Percent <strong>of</strong> Total 17.6% 18.8% 21.0% 26.8% 22.6% 25.0% 21.8% 20.7% 16.3%American Indian 0 0 1 0 0 0 0 1 0Population 10 to 17 470 492 508 519 517 544 516 493 461Rate per 100,000 0.00 0.00 196.85 0.00 0.00 0.00 0.00 202.84 0.00Percent <strong>of</strong> Total 0.0% 0.0% 0.1% 0.0% 0.0% 0.0% 0.0% 0.1% 0.0%Asian/Pacific Isl<strong>and</strong>er 15 12 11 5 7 7 10 10 7Population 10 to 17 4,858 5,054 5,333 5,569 5,724 4,984 4,953 4,966 4,941Rate per 100,000 308.77 237.44 206.26 89.78 122.29 140.45 201.90 201.37 141.67Percent <strong>of</strong> Total 1.9% 1.5% 1.3% 0.7% 0.9% 0.9% 1.4% 1.4% 1.0%Black 17 20 14 16 16 12 17 15 15Population 10 to 17 1,795 1,732 1,693 1,620 1,505 1,678 1,624 1,594 1,523Rate per 100,000 947.08 1,154.73 826.93 987.65 1,063.12 715.14 1,046.80 941.03 984.90Percent <strong>of</strong> Total 2.1% 2.4% 1.7% 2.3% 2.1% 1.6% 2.4% 2.0% 2.2%Hispanic 384 395 370 335 391 411 349 390 350Population 10 to 17 38,131 40,168 42,321 44,360 46,089 43,642 44,175 44,566 44,417Rate per 100,000 1,007.05 983.37 874.27 755.18 848.36 941.75 790.04 875.11 787.99Percent <strong>of</strong> Total 48.2% 48.0% 44.3% 48.2% 51.1% 55.2% 50.3% 52.8% 51.5%White 376 393 436 332 342 309 316 318 302Population 10 to 17 47,908 48,631 48,785 48,407 47,493 47,818 47,045 45,894 44,249Rate per 100,000 784.84 808.13 893.72 685.85 720.11 646.20 671.70 692.90 682.50Percent <strong>of</strong> Total 47.2% 47.8% 52.2% 47.8% 44.7% 41.5% 45.5% 43.1% 44.4%Other 5 3 3 7 9 5 2 4 6Percent <strong>of</strong> Total 0.6% 0.4% 0.4% 1.0% 1.2% 0.7% 0.3% 0.5% 0.9%Indicators <strong>of</strong> <strong>Alcohol</strong> <strong>and</strong> Other <strong>Drug</strong> Abuse • <strong>Drug</strong>Related Crime • <strong>Ventura</strong> <strong>County</strong>, <strong>California</strong> 21