Ventura County - Alcohol and Drug Programs - State of California
Ventura County - Alcohol and Drug Programs - State of California
Ventura County - Alcohol and Drug Programs - State of California
- No tags were found...

You also want an ePaper? Increase the reach of your titles
YUMPU automatically turns print PDFs into web optimized ePapers that Google loves.
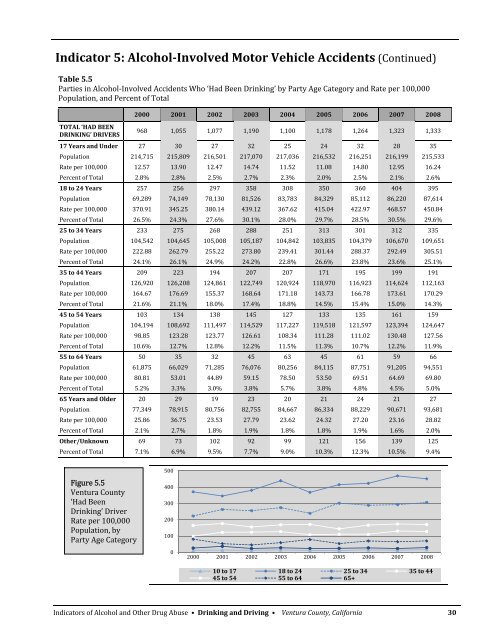
Indicator 5: <strong>Alcohol</strong>Involved Motor Vehicle Accidents (Continued)Table 5.5Parties in <strong>Alcohol</strong>‐Involved Accidents Who ‘Had Been Drinking’ by Party Age Category <strong>and</strong> Rate per 100,000Population, <strong>and</strong> Percent <strong>of</strong> TotalTOTAL ‘HAD BEENDRINKING’ DRIVERS2000 2001 2002 2003 2004 2005 2006 2007 2008968 1,055 1,077 1,190 1,100 1,178 1,264 1,323 1,33317 Years <strong>and</strong> Under 27 30 27 32 25 24 32 28 35Population 214,715 215,809 216,501 217,070 217,036 216,532 216,251 216,199 215,533Rate per 100,000 12.57 13.90 12.47 14.74 11.52 11.08 14.80 12.95 16.24Percent <strong>of</strong> Total 2.8% 2.8% 2.5% 2.7% 2.3% 2.0% 2.5% 2.1% 2.6%18 to 24 Years 257 256 297 358 308 350 360 404 395Population 69,289 74,149 78,130 81,526 83,783 84,329 85,112 86,220 87,614Rate per 100,000 370.91 345.25 380.14 439.12 367.62 415.04 422.97 468.57 450.84Percent <strong>of</strong> Total 26.5% 24.3% 27.6% 30.1% 28.0% 29.7% 28.5% 30.5% 29.6%25 to 34 Years 233 275 268 288 251 313 301 312 335Population 104,542 104,645 105,008 105,187 104,842 103,835 104,379 106,670 109,651Rate per 100,000 222.88 262.79 255.22 273.80 239.41 301.44 288.37 292.49 305.51Percent <strong>of</strong> Total 24.1% 26.1% 24.9% 24.2% 22.8% 26.6% 23.8% 23.6% 25.1%35 to 44 Years 209 223 194 207 207 171 195 199 191Population 126,920 126,208 124,861 122,749 120,924 118,970 116,923 114,624 112,163Rate per 100,000 164.67 176.69 155.37 168.64 171.18 143.73 166.78 173.61 170.29Percent <strong>of</strong> Total 21.6% 21.1% 18.0% 17.4% 18.8% 14.5% 15.4% 15.0% 14.3%45 to 54 Years 103 134 138 145 127 133 135 161 159Population 104,194 108,692 111,497 114,529 117,227 119,518 121,597 123,394 124,647Rate per 100,000 98.85 123.28 123.77 126.61 108.34 111.28 111.02 130.48 127.56Percent <strong>of</strong> Total 10.6% 12.7% 12.8% 12.2% 11.5% 11.3% 10.7% 12.2% 11.9%55 to 64 Years 50 35 32 45 63 45 61 59 66Population 61,875 66,029 71,285 76,076 80,256 84,115 87,751 91,205 94,551Rate per 100,000 80.81 53.01 44.89 59.15 78.50 53.50 69.51 64.69 69.80Percent <strong>of</strong> Total 5.2% 3.3% 3.0% 3.8% 5.7% 3.8% 4.8% 4.5% 5.0%65 Years <strong>and</strong> Older 20 29 19 23 20 21 24 21 27Population 77,349 78,915 80,756 82,755 84,667 86,334 88,229 90,671 93,681Rate per 100,000 25.86 36.75 23.53 27.79 23.62 24.32 27.20 23.16 28.82Percent <strong>of</strong> Total 2.1% 2.7% 1.8% 1.9% 1.8% 1.8% 1.9% 1.6% 2.0%Other/Unknown 69 73 102 92 99 121 156 139 125Percent <strong>of</strong> Total 7.1% 6.9% 9.5% 7.7% 9.0% 10.3% 12.3% 10.5% 9.4%Figure 5.5<strong>Ventura</strong> <strong>County</strong>‘Had BeenDrinking’ DriverRate per 100,000Population, byParty Age Category50040030020010002000 2001 2002 2003 2004 2005 2006 2007 200810 to 17 18 to 24 25 to 34 35 to 4445 to 54 55 to 64 65+Indicators <strong>of</strong> <strong>Alcohol</strong> <strong>and</strong> Other <strong>Drug</strong> Abuse • Drinking <strong>and</strong> Driving • <strong>Ventura</strong> <strong>County</strong>, <strong>California</strong> 30