Ventura County - Alcohol and Drug Programs - State of California
Ventura County - Alcohol and Drug Programs - State of California
Ventura County - Alcohol and Drug Programs - State of California
- No tags were found...

Create successful ePaper yourself
Turn your PDF publications into a flip-book with our unique Google optimized e-Paper software.
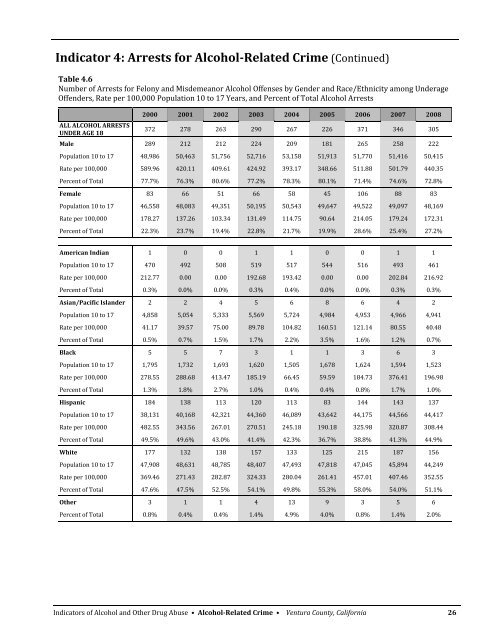
Indicator 4: Arrests for <strong>Alcohol</strong>Related Crime (Continued)Table 4.6Number <strong>of</strong> Arrests for Felony <strong>and</strong> Misdemeanor <strong>Alcohol</strong> Offenses by Gender <strong>and</strong> Race/Ethnicity among UnderageOffenders, Rate per 100,000 Population 10 to 17 Years, <strong>and</strong> Percent <strong>of</strong> Total <strong>Alcohol</strong> ArrestsALL ALCOHOL ARRESTSUNDER AGE 182000 2001 2002 2003 2004 2005 2006 2007 2008372 278 263 290 267 226 371 346 305Male 289 212 212 224 209 181 265 258 222Population 10 to 17 48,986 50,463 51,756 52,716 53,158 51,913 51,770 51,416 50,415Rate per 100,000 589.96 420.11 409.61 424.92 393.17 348.66 511.88 501.79 440.35Percent <strong>of</strong> Total 77.7% 76.3% 80.6% 77.2% 78.3% 80.1% 71.4% 74.6% 72.8%Female 83 66 51 66 58 45 106 88 83Population 10 to 17 46,558 48,083 49,351 50,195 50,543 49,647 49,522 49,097 48,169Rate per 100,000 178.27 137.26 103.34 131.49 114.75 90.64 214.05 179.24 172.31Percent <strong>of</strong> Total 22.3% 23.7% 19.4% 22.8% 21.7% 19.9% 28.6% 25.4% 27.2%American Indian 1 0 0 1 1 0 0 1 1Population 10 to 17 470 492 508 519 517 544 516 493 461Rate per 100,000 212.77 0.00 0.00 192.68 193.42 0.00 0.00 202.84 216.92Percent <strong>of</strong> Total 0.3% 0.0% 0.0% 0.3% 0.4% 0.0% 0.0% 0.3% 0.3%Asian/Pacific Isl<strong>and</strong>er 2 2 4 5 6 8 6 4 2Population 10 to 17 4,858 5,054 5,333 5,569 5,724 4,984 4,953 4,966 4,941Rate per 100,000 41.17 39.57 75.00 89.78 104.82 160.51 121.14 80.55 40.48Percent <strong>of</strong> Total 0.5% 0.7% 1.5% 1.7% 2.2% 3.5% 1.6% 1.2% 0.7%Black 5 5 7 3 1 1 3 6 3Population 10 to 17 1,795 1,732 1,693 1,620 1,505 1,678 1,624 1,594 1,523Rate per 100,000 278.55 288.68 413.47 185.19 66.45 59.59 184.73 376.41 196.98Percent <strong>of</strong> Total 1.3% 1.8% 2.7% 1.0% 0.4% 0.4% 0.8% 1.7% 1.0%Hispanic 184 138 113 120 113 83 144 143 137Population 10 to 17 38,131 40,168 42,321 44,360 46,089 43,642 44,175 44,566 44,417Rate per 100,000 482.55 343.56 267.01 270.51 245.18 190.18 325.98 320.87 308.44Percent <strong>of</strong> Total 49.5% 49.6% 43.0% 41.4% 42.3% 36.7% 38.8% 41.3% 44.9%White 177 132 138 157 133 125 215 187 156Population 10 to 17 47,908 48,631 48,785 48,407 47,493 47,818 47,045 45,894 44,249Rate per 100,000 369.46 271.43 282.87 324.33 280.04 261.41 457.01 407.46 352.55Percent <strong>of</strong> Total 47.6% 47.5% 52.5% 54.1% 49.8% 55.3% 58.0% 54.0% 51.1%Other 3 1 1 4 13 9 3 5 6Percent <strong>of</strong> Total 0.8% 0.4% 0.4% 1.4% 4.9% 4.0% 0.8% 1.4% 2.0%Indicators <strong>of</strong> <strong>Alcohol</strong> <strong>and</strong> Other <strong>Drug</strong> Abuse • <strong>Alcohol</strong>Related Crime • <strong>Ventura</strong> <strong>County</strong>, <strong>California</strong> 26