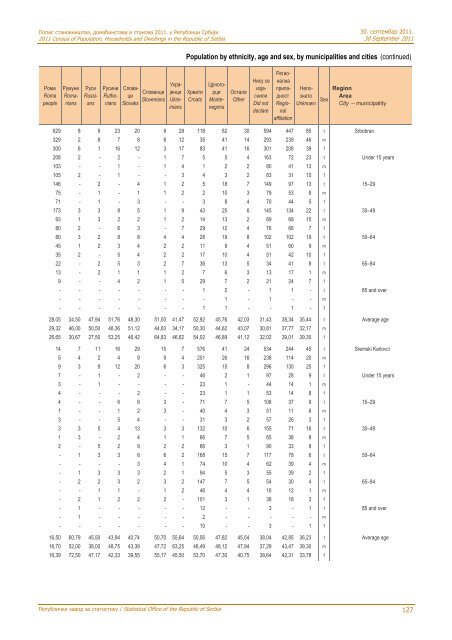
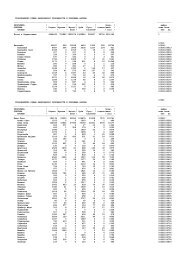
Попис становништва, домаћинстава и станова 2011. у Републици Србији2011 Census of Population, Households <strong>and</strong> Dwellings in the Republic of Serbia30. септембар 2011.30 September 2011Population by <strong>ethnicity</strong>, age <strong>and</strong> sex, by municipalities <strong>and</strong> cities (continued)РомиRomapeopleРумуниRomaniansРусиRussiansРусиниRutheniansСловациSlovaksСловенциSloveniansХрватиCroatsУкрајинциUkrainiansЦрногорциMontenegrinsОсталиOtherНису сеизјаснилиDid notdeclareРегионалнаприпадностRegionalaffiliationНепознатоRegionUnknown Sex AreaCity – municipality629 8 9 23 20 9 29 118 82 30 594 447 85 t Srbobran329 2 8 7 8 6 12 35 41 14 293 239 46 m300 6 1 16 12 3 17 83 41 16 301 208 39 f208 2 - 2 - 1 7 5 5 4 163 72 23 t Under 15 years103 - - 1 - 1 4 1 2 2 80 41 13 m105 2 - 1 - - 3 4 3 2 83 31 10 f146 - 2 - 4 1 2 5 18 7 149 97 13 t 15–2975 - 1 - 1 1 2 2 10 3 79 53 8 m71 - 1 - 3 - - 3 8 4 70 44 5 f173 3 3 8 5 1 9 43 25 6 145 134 22 t 30–4993 1 3 2 2 1 2 14 13 2 69 68 15 m80 2 - 6 3 - 7 29 12 4 76 66 7 f80 3 2 8 8 4 4 28 19 8 102 102 19 t 50–6445 1 2 3 4 2 2 11 9 4 51 60 9 m35 2 - 5 4 2 2 17 10 4 51 42 10 f22 - 2 5 3 2 7 36 13 5 34 41 8 t 65–8413 - 2 1 1 1 2 7 6 3 13 17 1 m9 - - 4 2 1 5 29 7 2 21 24 7 f- - - - - - - 1 2 - 1 1 - t 85 <strong>and</strong> over- - - - - - - - 1 - 1 - - m- - - - - - - 1 1 - - 1 - f28,05 34,50 47,94 51,76 48,30 51,50 41,47 52,92 45,76 42,03 31,43 38,34 35,44 t Average age29,32 46,00 50,50 48,36 51,12 44,83 34,17 50,30 44,62 43,07 30,81 37,77 32,17 m26,65 30,67 27,50 53,25 46,42 64,83 46,62 54,02 46,89 41,12 32,02 39,01 39,30 f14 7 11 16 29 15 7 576 41 24 534 244 45 t Sremski Karlovci5 4 2 4 9 9 4 251 26 16 238 114 20 m9 3 9 12 20 6 3 325 15 8 296 130 25 f7 - 1 - 2 - - 46 2 1 97 28 9 t Under 15 years3 - 1 - - - - 23 1 - 44 14 1 m4 - - - 2 - - 23 1 1 53 14 8 f4 - - 6 6 3 - 71 7 5 108 37 9 t 15–291 - - 1 2 3 - 40 4 3 51 11 6 m3 - - 5 4 - - 31 3 2 57 26 3 f3 3 5 4 13 3 3 132 10 6 155 71 16 t 30–491 3 - 2 4 1 1 66 7 5 65 38 8 m2 - 5 2 9 2 2 66 3 1 90 33 8 f- 1 3 3 6 6 2 168 15 7 117 78 6 t 50–64- - - - 3 4 1 74 10 4 62 39 4 m- 1 3 3 3 2 1 94 5 3 55 39 2 f- 2 2 3 2 3 2 147 7 5 54 30 4 t 65–84- - 1 1 - 1 2 46 4 4 16 12 1 m- 2 1 2 2 2 - 101 3 1 38 18 3 f- 1 - - - - - 12 - - 3 - 1 t 85 <strong>and</strong> over- 1 - - - - - 2 - - - - - m- - - - - - - 10 - - 3 - 1 f16,50 60,79 45,50 43,94 40,74 50,70 55,64 50,56 47,82 45,54 38,04 42,85 36,23 t Average age16,70 52,00 38,00 48,75 43,39 47,72 63,25 46,49 48,12 47,94 37,29 43,47 39,30 m16,39 72,50 47,17 42,33 39,55 55,17 45,50 53,70 47,30 40,75 38,64 42,31 33,78 f<strong>Републички</strong> <strong><strong>за</strong>вод</strong> <strong>за</strong> статистику / Statistical Office of the Republic of Serbia127
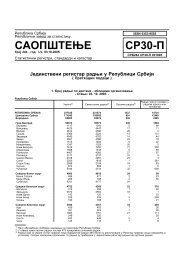
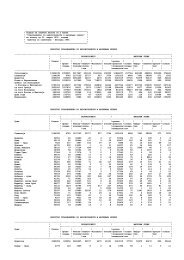
30. септембар 2011.30 September 2011Попис становништва, домаћинстава и станова 2011. у Републици Србији2011 Census of Population, Households <strong>and</strong> Dwellings in the Republic of Serbia4. Становништво према националној припадности, старости и полу, по општинама и градовима (наставак)РегионОбластГрад – општинаПолУкупноTotalСрбиSerbsAлбанциAlbaniansБошњациBosniaksБуњевциBunjevciВласиVlachsГоранциGoranciБугариBulgariansЈугословениYugoslavsМађариHungariansМакедонциMacedoniansМуслиманиMuslimsНемциGermansТемерин с 28287 19112 10 1 3 8 - - 122 7460 28 18 16м 13931 9555 7 - 2 2 - - 69 3569 10 8 7ж 14356 9557 3 1 1 6 - - 53 3891 18 10 9Испод 15 година с 4364 3093 1 - - 1 - - 7 959 1 4 1м 2302 1615 - - - - - - 4 516 1 2 -ж 2062 1478 1 - - 1 - - 3 443 - 2 115–29 с 5487 3837 2 - - - - - 19 1317 5 2 -м 2790 1960 1 - - - - - 11 662 1 1 -ж 2697 1877 1 - - - - - 8 655 4 1 -30–49 с 7830 5309 5 - - 2 - - 50 2017 6 5 -м 3979 2741 4 - - 1 - - 29 1006 2 2 -ж 3851 2568 1 - - 1 - - 21 1011 4 3 -50–64 с 6543 4449 2 - 2 2 - - 39 1699 13 7 4м 3172 2177 2 - 2 1 - - 22 813 5 3 2ж 3371 2272 - - - 1 - - 17 886 8 4 265–84 с 3857 2321 - 1 1 3 - - 7 1368 3 - 11м 1628 1031 - - - - - - 3 543 1 - 5ж 2229 1290 - 1 1 3 - - 4 825 2 - 685 и више с 206 103 - - - - - - - 100 - - -м 60 31 - - - - - - - 29 - - -ж 146 72 - - - - - - - 71 - - -Просечна старост с 40,51 39,65 36,50 68,50 66,17 50,12 - - 43,13 43,38 47,29 39,61 65,56м 39,11 38,63 40,79 - 61,00 48,50 - - 42,53 41,28 48,00 37,62 68,50ж 41,88 40,66 26,50 68,50 76,50 50,67 - - 43,92 45,29 46,89 41,20 63,28Тител с 15738 13615 24 - 16 3 - - 50 822 53 3 19м 7885 6843 17 - 6 - - - 24 406 21 1 13ж 7853 6772 7 - 10 3 - - 26 416 32 2 6Испод 15 година с 2377 2048 6 - 3 - - - 4 98 7 - 1м 1195 1035 5 - 2 - - - 1 41 4 - 1ж 1182 1013 1 - 1 - - - 3 57 3 - -15–29 с 3023 2661 3 - 1 - - - 3 131 5 - 2м 1613 1418 2 - 1 - - - 1 79 1 - 2ж 1410 1243 1 - - - - - 2 52 4 - -30–49 с 4268 3703 11 - 2 1 - - 11 213 14 2 5м 2244 1956 7 - 1 - - - 5 111 5 - 3ж 2024 1747 4 - 1 1 - - 6 102 9 2 250–64 с 3593 3069 4 - 4 2 - - 25 219 21 - 3м 1840 1575 3 - 2 - - - 10 114 7 - 2ж 1753 1494 1 - 2 2 - - 15 105 14 - 165–84 с 2326 2010 - - 6 - - - 7 149 5 1 8м 950 819 - - - - - - 7 59 3 1 5ж 1376 1191 - - 6 - - - - 90 2 - 385 и више с 151 124 - - - - - - - 12 1 - -м 43 40 - - - - - - - 2 1 - -ж 108 84 - - - - - - - 10 - - -Просечна старост с 41,22 41,12 32,92 - 50,06 51,50 - - 50,96 44,55 44,33 49,83 52,34м 39,86 39,82 31,09 - 35,00 - - - 55,71 42,75 43,69 67,50 48,27ж 42,58 42,42 37,36 - 59,10 51,50 - - 46,58 46,30 44,75 41,00 61,17128<strong>Републички</strong> <strong><strong>за</strong>вод</strong> <strong>за</strong> статистику / Statistical Office of the Republic of Serbia
- Page 2 and 3:
Република СрбијаРе
- Page 4 and 5:
Попис становништва
- Page 6 and 7:
Попис становништва
- Page 8 and 9:
Попис становништва
- Page 10 and 11:
Попис становништва
- Page 12 and 13:
Попис становништва
- Page 14 and 15:
Попис становништва
- Page 16 and 17:
Попис становништва
- Page 18 and 19:
Попис становништва
- Page 20 and 21:
Попис становништва
- Page 22 and 23:
Попис становништва
- Page 24 and 25:
Попис становништва
- Page 26 and 27:
Попис становништва
- Page 28 and 29:
Попис становништва
- Page 30 and 31:
Попис становништва
- Page 32 and 33:
Попис становништва
- Page 34 and 35:
Попис становништва
- Page 36 and 37:
Попис становништва
- Page 38 and 39:
Попис становништва
- Page 40 and 41:
Попис становништва
- Page 42 and 43:
Попис становништва
- Page 44 and 45:
Попис становништва
- Page 46 and 47:
Попис становништва
- Page 48 and 49:
Попис становништва
- Page 50 and 51:
Попис становништва
- Page 52 and 53:
Попис становништва
- Page 54 and 55:
Попис становништва
- Page 56 and 57:
Попис становништва
- Page 58 and 59:
Попис становништва
- Page 60 and 61:
Попис становништва
- Page 62 and 63:
Попис становништва
- Page 64 and 65:
Попис становништва
- Page 66 and 67:
Попис становништва
- Page 68 and 69:
Попис становништва
- Page 70 and 71:
Попис становништва
- Page 72 and 73:
Попис становништва
- Page 74 and 75:
Попис становништва
- Page 76 and 77:
Попис становништва
- Page 78 and 79: Попис становништва
- Page 80 and 81: Попис становништва
- Page 82 and 83: Попис становништва
- Page 84 and 85: Попис становништва
- Page 86 and 87: Попис становништва
- Page 88 and 89: Попис становништва
- Page 90 and 91: Попис становништва
- Page 92 and 93: Попис становништва
- Page 94 and 95: Попис становништва
- Page 96 and 97: Попис становништва
- Page 98 and 99: Попис становништва
- Page 100 and 101: Попис становништва
- Page 102 and 103: Попис становништва
- Page 104 and 105: Попис становништва
- Page 106 and 107: Попис становништва
- Page 108 and 109: Попис становништва
- Page 110 and 111: Попис становништва
- Page 112 and 113: Попис становништва
- Page 114 and 115: Попис становништва
- Page 116 and 117: Попис становништва
- Page 118 and 119: Попис становништва
- Page 120 and 121: Попис становништва
- Page 122 and 123: Попис становништва
- Page 124 and 125: Попис становништва
- Page 126 and 127: Попис становништва
- Page 130 and 131: Попис становништва
- Page 132 and 133: Попис становништва
- Page 134 and 135: Попис становништва
- Page 136 and 137: Попис становништва
- Page 138 and 139: Попис становништва
- Page 140 and 141: Попис становништва
- Page 142 and 143: Попис становништва
- Page 144 and 145: Попис становништва
- Page 146 and 147: Попис становништва
- Page 148 and 149: Попис становништва
- Page 150 and 151: Попис становништва
- Page 152 and 153: Попис становништва
- Page 154 and 155: Попис становништва
- Page 156 and 157: Попис становништва
- Page 158 and 159: Попис становништва
- Page 160 and 161: Попис становништва
- Page 162 and 163: Попис становништва
- Page 164 and 165: Попис становништва
- Page 166 and 167: Попис становништва
- Page 168 and 169: Попис становништва
- Page 170 and 171: Попис становништва
- Page 172 and 173: Попис становништва
- Page 174 and 175: Попис становништва
- Page 176 and 177: Попис становништва
- Page 178 and 179:
Попис становништва
- Page 180 and 181:
Попис становништва
- Page 182 and 183:
Попис становништва
- Page 184 and 185:
Попис становништва
- Page 186 and 187:
Попис становништва
- Page 188 and 189:
Попис становништва
- Page 190 and 191:
Попис становништва
- Page 192 and 193:
Попис становништва
- Page 194 and 195:
Попис становништва
- Page 196 and 197:
Попис становништва
- Page 198 and 199:
Попис становништва
- Page 200 and 201:
Попис становништва
- Page 202 and 203:
Попис становништва
- Page 204 and 205:
Попис становништва
- Page 206 and 207:
Попис становништва
- Page 208 and 209:
Попис становништва
- Page 210 and 211:
Попис становништва
- Page 212 and 213:
Попис становништва
- Page 214 and 215:
Попис становништва
- Page 216 and 217:
Попис становништва
- Page 218 and 219:
Попис становништва
- Page 220 and 221:
Попис становништва
- Page 222 and 223:
Попис становништва
- Page 224 and 225:
Попис становништва
- Page 226 and 227:
Попис становништва
- Page 228 and 229:
Попис становништва
- Page 230 and 231:
Попис становништва
- Page 232 and 233:
Попис становништва
- Page 234 and 235:
Попис становништва
- Page 236 and 237:
Попис становништва
- Page 238 and 239:
Попис становништва
- Page 240 and 241:
Попис становништва
- Page 242 and 243:
Попис становништва
- Page 244 and 245:
Попис становништва
- Page 246 and 247:
Попис становништва
- Page 248 and 249:
Попис становништва
- Page 250 and 251:
Попис становништва
- Page 252 and 253:
Попис становништва
- Page 254 and 255:
Попис становништва
- Page 256 and 257:
Попис становништва
- Page 258 and 259:
Попис становништва
- Page 260 and 261:
Попис становништва
- Page 262 and 263:
Попис становништва
- Page 264 and 265:
Попис становништва
- Page 266 and 267:
Попис становништва
- Page 268 and 269:
Попис становништва
- Page 270 and 271:
Попис становништва
- Page 272 and 273:
Попис становништва
- Page 274 and 275:
Попис становништва
- Page 276 and 277:
Попис становништва
- Page 278 and 279:
Попис становништва
- Page 280 and 281:
Попис становништва
- Page 282 and 283:
Попис становништва
- Page 284 and 285:
Попис становништва
- Page 286 and 287:
Подаци из овог обра
- Page 288 and 289:
27.ГДЕ ЛИЦЕ ПОХАЂА Ш
- Page 290 and 291:
Подаци из овог обра
- Page 292 and 293:
Сродство с лицем на
- Page 302:
ВЕРОИСПОВЕСТ, МАТЕ