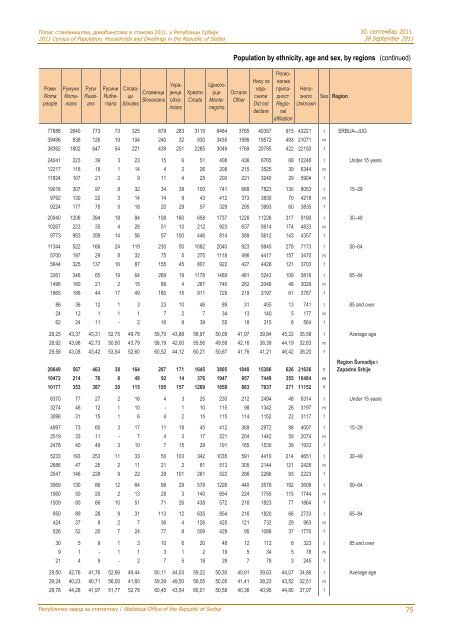
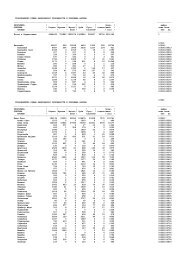
Попис становништва, домаћинстава и станова 2011. у Републици Србији2011 Census of Population, Households <strong>and</strong> Dwellings in the Republic of Serbia30. септембар 2011.30 September 2011Population by <strong>ethnicity</strong>, age <strong>and</strong> sex, by regions (continued)РомиRomapeopleРумуниRomaniansРусиRussiansРусиниRutheniansСловациSlovaksСловенциSloveniansХрватиCroatsУкрајинциUkrainiansЦрногорциMontenegrinsОсталиOtherНису сеизјаснилиDid notdeclareРегионалнаприпадностRegionalaffiliationНепознатоUnknownSex Region77888 2640 773 73 325 679 283 3115 6484 3765 40357 915 43221 t SRBIJA–JUG39496 838 126 19 104 240 32 830 3435 1996 19572 493 21071 m38392 1802 647 54 221 439 251 2285 3049 1769 20785 422 22150 f24041 223 39 3 23 15 6 51 408 436 6765 68 12248 t Under 15 years12217 116 18 1 14 4 2 26 208 215 3525 39 6344 m11824 107 21 2 9 11 4 25 200 221 3240 29 5904 f19016 307 97 8 32 34 38 100 741 668 7823 130 8053 t 15–299792 130 22 3 14 14 9 43 412 373 3830 70 4218 m9224 177 75 5 18 20 29 57 329 295 3993 60 3835 f20040 1206 394 18 84 108 160 658 1737 1226 11226 317 9190 t 30–4910267 223 35 4 28 51 10 212 923 637 5614 174 4833 m9773 983 359 14 56 57 150 446 814 589 5612 143 4357 f11344 522 166 24 119 230 50 1082 2040 923 8845 278 7173 t 50–645700 197 29 8 32 75 5 275 1118 496 4417 157 3470 m5644 325 137 16 87 155 45 807 922 427 4428 121 3703 f3361 346 65 19 64 269 19 1178 1469 481 5243 109 5816 t 65–841496 160 21 2 15 89 4 267 740 262 2046 48 2029 m1865 186 44 17 49 180 15 911 729 219 3197 61 3787 f86 36 12 1 3 23 10 46 89 31 455 13 741 t 85 <strong>and</strong> over24 12 1 1 1 7 2 7 34 13 140 5 177 m62 24 11 - 2 16 8 39 55 18 315 8 564 f29,25 43,37 43,31 52,75 49,78 59,70 43,88 58,97 50,09 41,97 39,84 45,22 35,58 t Average age28,92 43,98 42,73 50,50 43,79 58,19 42,00 55,56 49,59 42,16 38,39 44,19 32,83 m29,58 43,08 43,42 53,54 52,60 60,52 44,12 60,21 50,67 41,76 41,21 46,42 38,20 f20649 567 463 38 164 287 171 1645 3805 1840 15386 626 21636 t10472 214 76 8 49 92 14 376 1947 957 7449 355 10484 m10177 353 387 30 115 195 157 1269 1858 883 7937 271 11152 fRegion Šumadije iZapadne Srbije6370 77 27 2 16 4 3 25 230 212 2494 48 6314 t Under 15 years3274 46 12 1 10 - 1 10 115 98 1342 26 3197 m3096 31 15 1 6 4 2 15 115 114 1152 22 3117 f4997 73 60 3 17 11 18 45 412 369 2972 98 4007 t 15–292519 33 11 - 7 4 3 17 221 204 1442 59 2074 m2478 40 49 3 10 7 15 28 191 165 1530 39 1933 f5233 193 253 11 33 50 103 342 1035 591 4410 214 4651 t 30–492686 47 25 2 11 21 2 81 513 305 2144 121 2428 m2547 146 228 9 22 29 101 261 522 286 2266 93 2223 f3069 130 86 12 64 99 29 578 1226 440 3578 192 3608 t 50–641560 50 20 2 13 28 3 140 654 224 1755 115 1744 m1509 80 66 10 51 71 26 438 572 216 1823 77 1864 f950 89 28 9 31 113 12 635 854 216 1820 66 2733 t 65–84424 37 8 2 7 36 4 126 425 121 732 29 963 m526 52 20 7 24 77 8 509 429 95 1088 37 1770 f30 5 9 1 3 10 6 20 48 12 112 8 323 t 85 <strong>and</strong> over9 1 - 1 1 3 1 2 19 5 34 5 78 m21 4 9 - 2 7 5 18 29 7 78 3 245 f29,50 42,76 41,76 52,66 49,44 60,11 44,03 59,22 50,30 40,91 39,63 44,07 34,86 t Average age29,24 40,23 40,71 56,00 41,60 59,39 49,50 56,55 50,05 41,41 38,23 43,52 32,51 m29,78 44,28 41,97 51,77 52,78 60,45 43,54 60,01 50,58 40,36 40,95 44,80 37,07 f<strong>Републички</strong> <strong><strong>за</strong>вод</strong> <strong>за</strong> статистику / Statistical Office of the Republic of Serbia75
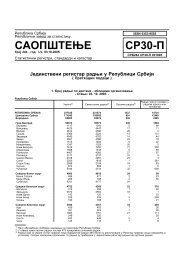
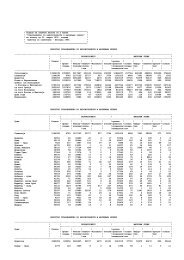
30. септембар 2011.30 September 2011Попис становништва, домаћинстава и станова 2011. у Републици Србији2011 Census of Population, Households <strong>and</strong> Dwellings in the Republic of Serbia3. Становништво према националној припадности, старости и полу по регионима (наставак)Регион Пол УкупноTotalСрбиSerbsAлбанциAlbaniansБошњациBosniaksБуњевциBunjevciВласиVlachsГоранциGoranciБугариBulgariansЈугословениYugoslavsМађариHungariansМакедонциMacedoniansМуслиманиMuslimsНемциGermansРегион Јужне иИсточне Србије с 1563916 1393673 1715 135 15501 24 32873 566 1431 520 3539 534 164м 772913 688481 956 75 8370 10 16401 293 800 176 1246 271 75ж 791003 705192 759 60 7131 14 16472 273 631 344 2293 263 89Испод 15 година с 216593 183274 275 10 1291 1 2949 96 44 13 79 46 11м 111662 94603 145 6 652 1 1515 46 22 6 40 27 2ж 104931 88671 130 4 639 - 1434 50 22 7 39 19 915–29 с 278942 248382 369 18 1836 2 3613 130 145 64 318 85 15м 144578 128671 190 8 1007 - 1996 65 94 21 135 46 9ж 134364 119711 179 10 829 2 1617 65 51 43 183 39 630–49 с 405960 363131 485 41 3841 4 7192 173 443 133 1055 185 32м 206711 184613 264 21 2233 2 4162 94 251 44 310 78 14ж 199249 178518 221 20 1608 2 3030 79 192 89 745 107 1850–64 с 359415 324366 317 45 3940 6 8697 111 514 172 1358 163 41м 178458 160913 180 28 2220 4 4494 54 279 64 440 89 22ж 180957 163453 137 17 1720 2 4203 57 235 108 918 74 1965–84 с 283112 256817 263 21 4259 11 9589 54 266 130 703 54 62м 124411 113297 173 12 2126 3 3959 33 144 38 303 31 27ж 158701 143520 90 9 2133 8 5630 21 122 92 400 23 3585 и више с 19894 17703 6 - 334 - 833 2 19 8 26 1 3м 7093 6384 4 - 132 - 275 1 10 3 18 - 1ж 12801 11319 2 - 202 - 558 1 9 5 8 1 2Просечна старост с 43,26 43,67 39,52 46,90 50,42 57,79 51,43 37,12 50,74 52,47 52,04 43,57 54,62м 42,01 42,44 40,97 47,77 49,74 54,40 49,03 38,15 49,86 51,82 52,70 43,54 54,73ж 44,49 44,87 37,69 45,82 51,23 60,21 53,82 36,03 51,86 52,80 51,68 43,60 54,52Регион Косовo иМетохијa с … … … … … … … … … … … … …76<strong>Републички</strong> <strong><strong>за</strong>вод</strong> <strong>за</strong> статистику / Statistical Office of the Republic of Serbia
- Page 2 and 3:
Република СрбијаРе
- Page 4 and 5:
Попис становништва
- Page 6 and 7:
Попис становништва
- Page 8 and 9:
Попис становништва
- Page 10 and 11:
Попис становништва
- Page 12 and 13:
Попис становништва
- Page 14 and 15:
Попис становништва
- Page 16 and 17:
Попис становништва
- Page 18 and 19:
Попис становништва
- Page 20 and 21:
Попис становништва
- Page 22 and 23:
Попис становништва
- Page 24 and 25:
Попис становништва
- Page 26 and 27: Попис становништва
- Page 28 and 29: Попис становништва
- Page 30 and 31: Попис становништва
- Page 32 and 33: Попис становништва
- Page 34 and 35: Попис становништва
- Page 36 and 37: Попис становништва
- Page 38 and 39: Попис становништва
- Page 40 and 41: Попис становништва
- Page 42 and 43: Попис становништва
- Page 44 and 45: Попис становништва
- Page 46 and 47: Попис становништва
- Page 48 and 49: Попис становништва
- Page 50 and 51: Попис становништва
- Page 52 and 53: Попис становништва
- Page 54 and 55: Попис становништва
- Page 56 and 57: Попис становништва
- Page 58 and 59: Попис становништва
- Page 60 and 61: Попис становништва
- Page 62 and 63: Попис становништва
- Page 64 and 65: Попис становништва
- Page 66 and 67: Попис становништва
- Page 68 and 69: Попис становништва
- Page 70 and 71: Попис становништва
- Page 72 and 73: Попис становништва
- Page 74 and 75: Попис становништва
- Page 78 and 79: Попис становништва
- Page 80 and 81: Попис становништва
- Page 82 and 83: Попис становништва
- Page 84 and 85: Попис становништва
- Page 86 and 87: Попис становништва
- Page 88 and 89: Попис становништва
- Page 90 and 91: Попис становништва
- Page 92 and 93: Попис становништва
- Page 94 and 95: Попис становништва
- Page 96 and 97: Попис становништва
- Page 98 and 99: Попис становништва
- Page 100 and 101: Попис становништва
- Page 102 and 103: Попис становништва
- Page 104 and 105: Попис становништва
- Page 106 and 107: Попис становништва
- Page 108 and 109: Попис становништва
- Page 110 and 111: Попис становништва
- Page 112 and 113: Попис становништва
- Page 114 and 115: Попис становништва
- Page 116 and 117: Попис становништва
- Page 118 and 119: Попис становништва
- Page 120 and 121: Попис становништва
- Page 122 and 123: Попис становништва
- Page 124 and 125: Попис становништва
- Page 126 and 127:
Попис становништва
- Page 128 and 129:
Попис становништва
- Page 130 and 131:
Попис становништва
- Page 132 and 133:
Попис становништва
- Page 134 and 135:
Попис становништва
- Page 136 and 137:
Попис становништва
- Page 138 and 139:
Попис становништва
- Page 140 and 141:
Попис становништва
- Page 142 and 143:
Попис становништва
- Page 144 and 145:
Попис становништва
- Page 146 and 147:
Попис становништва
- Page 148 and 149:
Попис становништва
- Page 150 and 151:
Попис становништва
- Page 152 and 153:
Попис становништва
- Page 154 and 155:
Попис становништва
- Page 156 and 157:
Попис становништва
- Page 158 and 159:
Попис становништва
- Page 160 and 161:
Попис становништва
- Page 162 and 163:
Попис становништва
- Page 164 and 165:
Попис становништва
- Page 166 and 167:
Попис становништва
- Page 168 and 169:
Попис становништва
- Page 170 and 171:
Попис становништва
- Page 172 and 173:
Попис становништва
- Page 174 and 175:
Попис становништва
- Page 176 and 177:
Попис становништва
- Page 178 and 179:
Попис становништва
- Page 180 and 181:
Попис становништва
- Page 182 and 183:
Попис становништва
- Page 184 and 185:
Попис становништва
- Page 186 and 187:
Попис становништва
- Page 188 and 189:
Попис становништва
- Page 190 and 191:
Попис становништва
- Page 192 and 193:
Попис становништва
- Page 194 and 195:
Попис становништва
- Page 196 and 197:
Попис становништва
- Page 198 and 199:
Попис становништва
- Page 200 and 201:
Попис становништва
- Page 202 and 203:
Попис становништва
- Page 204 and 205:
Попис становништва
- Page 206 and 207:
Попис становништва
- Page 208 and 209:
Попис становништва
- Page 210 and 211:
Попис становништва
- Page 212 and 213:
Попис становништва
- Page 214 and 215:
Попис становништва
- Page 216 and 217:
Попис становништва
- Page 218 and 219:
Попис становништва
- Page 220 and 221:
Попис становништва
- Page 222 and 223:
Попис становништва
- Page 224 and 225:
Попис становништва
- Page 226 and 227:
Попис становништва
- Page 228 and 229:
Попис становништва
- Page 230 and 231:
Попис становништва
- Page 232 and 233:
Попис становништва
- Page 234 and 235:
Попис становништва
- Page 236 and 237:
Попис становништва
- Page 238 and 239:
Попис становништва
- Page 240 and 241:
Попис становништва
- Page 242 and 243:
Попис становништва
- Page 244 and 245:
Попис становништва
- Page 246 and 247:
Попис становништва
- Page 248 and 249:
Попис становништва
- Page 250 and 251:
Попис становништва
- Page 252 and 253:
Попис становништва
- Page 254 and 255:
Попис становништва
- Page 256 and 257:
Попис становништва
- Page 258 and 259:
Попис становништва
- Page 260 and 261:
Попис становништва
- Page 262 and 263:
Попис становништва
- Page 264 and 265:
Попис становништва
- Page 266 and 267:
Попис становништва
- Page 268 and 269:
Попис становништва
- Page 270 and 271:
Попис становништва
- Page 272 and 273:
Попис становништва
- Page 274 and 275:
Попис становништва
- Page 276 and 277:
Попис становништва
- Page 278 and 279:
Попис становништва
- Page 280 and 281:
Попис становништва
- Page 282 and 283:
Попис становништва
- Page 284 and 285:
Попис становништва
- Page 286 and 287:
Подаци из овог обра
- Page 288 and 289:
27.ГДЕ ЛИЦЕ ПОХАЂА Ш
- Page 290 and 291:
Подаци из овог обра
- Page 292 and 293:
Сродство с лицем на
- Page 302:
ВЕРОИСПОВЕСТ, МАТЕ