Distribution and numbers of wintering sea ducks ... - Lunds universitet
Distribution and numbers of wintering sea ducks ... - Lunds universitet
Distribution and numbers of wintering sea ducks ... - Lunds universitet

You also want an ePaper? Increase the reach of your titles
YUMPU automatically turns print PDFs into web optimized ePapers that Google loves.
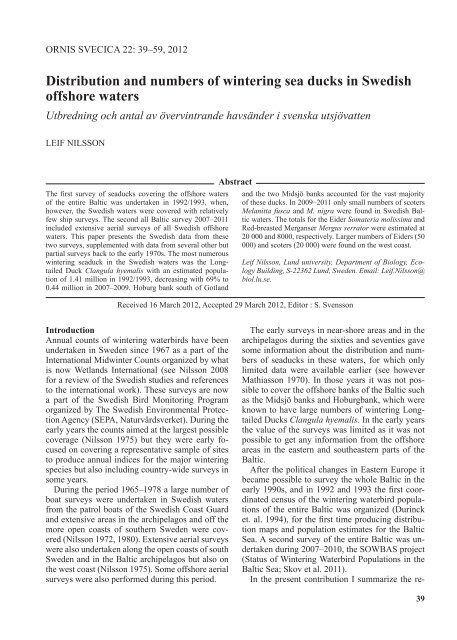
ORNIS SVECICA 22: 39–59, 2012<br />
<strong>Distribution</strong> <strong>and</strong> <strong>numbers</strong> <strong>of</strong> <strong>wintering</strong> <strong>sea</strong> <strong>ducks</strong> in Swedish<br />
<strong>of</strong>fshore waters<br />
Utbredning och antal av övervintr<strong>and</strong>e havsänder i svenska utsjövatten<br />
lEIf NIlSSON<br />
The first survey <strong>of</strong> <strong>sea</strong><strong>ducks</strong> covering the <strong>of</strong>fshore waters<br />
<strong>of</strong> the entire Baltic was undertaken in 1992/1993, when,<br />
however, the Swedish waters were covered with relatively<br />
few ship surveys. The second all Baltic survey 2007–2011<br />
included extensive aerial surveys <strong>of</strong> all Swedish <strong>of</strong>fshore<br />
waters. This paper presents the Swedish data from these<br />
two surveys, supplemented with data from several other but<br />
partial surveys back to the early 1970s. The most numerous<br />
<strong>wintering</strong> <strong>sea</strong>duck in the Swedish waters was the longtailed<br />
Duck Clangula hyemalis with an estimated population<br />
<strong>of</strong> 1.41 million in 1992/1993, decreasing with 69% to<br />
0.44 million in 2007–2009. Hoburg bank south <strong>of</strong> Gotl<strong>and</strong><br />
Introduction<br />
Annual counts <strong>of</strong> <strong>wintering</strong> waterbirds have been<br />
undertaken in Sweden since 1967 as a part <strong>of</strong> the<br />
International Midwinter Counts organized by what<br />
is now Wetl<strong>and</strong>s International (see Nilsson 2008<br />
for a review <strong>of</strong> the Swedish studies <strong>and</strong> references<br />
to the international work). These surveys are now<br />
a part <strong>of</strong> the Swedish Bird Monitoring Program<br />
organized by The Swedish Environmental Protection<br />
Agency (SEPA, Naturvårdsverket). During the<br />
early years the counts aimed at the largest possible<br />
coverage (Nilsson 1975) but they were early focused<br />
on covering a representative sample <strong>of</strong> sites<br />
to produce annual indices for the major <strong>wintering</strong><br />
species but also including country-wide surveys in<br />
some years.<br />
During the period 1965–1978 a large number <strong>of</strong><br />
boat surveys were undertaken in Swedish waters<br />
from the patrol boats <strong>of</strong> the Swedish Coast Guard<br />
<strong>and</strong> extensive areas in the archipelagos <strong>and</strong> <strong>of</strong>f the<br />
more open coasts <strong>of</strong> southern Sweden were covered<br />
(Nilsson 1972, 1980). Extensive aerial surveys<br />
were also undertaken along the open coasts <strong>of</strong> south<br />
Sweden <strong>and</strong> in the Baltic archipelagos but also on<br />
the west coast (Nilsson 1975). Some <strong>of</strong>fshore aerial<br />
surveys were also performed during this period.<br />
Abstract<br />
<strong>and</strong> the two Midsjö banks accounted for the vast majority<br />
<strong>of</strong> these <strong>ducks</strong>. In 2009–2011 only small <strong>numbers</strong> <strong>of</strong> scoters<br />
Melanitta fusca <strong>and</strong> M. nigra were found in Swedish Baltic<br />
waters. The totals for the Eider Somateria molissima <strong>and</strong><br />
Red-breasted Merganser Mergus serrator were estimated at<br />
20 000 <strong>and</strong> 8000, respectively. larger <strong>numbers</strong> <strong>of</strong> Eiders (50<br />
000) <strong>and</strong> scoters (20 000) were found on the west coast.<br />
Leif Nilsson, Lund university, Department <strong>of</strong> Biology, Ecology<br />
Building, S-22362 Lund, Sweden. Email: Leif.Nilsson@<br />
biol.lu.se.<br />
Received 16 March 2012, Accepted 29 March 2012, Editor : S. Svensson<br />
The early surveys in near-shore areas <strong>and</strong> in the<br />
archipelagos during the sixties <strong>and</strong> seventies gave<br />
some information about the distribution <strong>and</strong> <strong>numbers</strong><br />
<strong>of</strong> <strong>sea</strong><strong>ducks</strong> in these waters, for which only<br />
limited data were available earlier (see however<br />
Mathiasson 1970). In those years it was not possible<br />
to cover the <strong>of</strong>fshore banks <strong>of</strong> the Baltic such<br />
as the Midsjö banks <strong>and</strong> Hoburgbank, which were<br />
known to have large <strong>numbers</strong> <strong>of</strong> <strong>wintering</strong> longtailed<br />
Ducks Clangula hyemalis. In the early years<br />
the value <strong>of</strong> the surveys was limited as it was not<br />
possible to get any information from the <strong>of</strong>fshore<br />
areas in the eastern <strong>and</strong> southeastern parts <strong>of</strong> the<br />
Baltic.<br />
After the political changes in Eastern Europe it<br />
became possible to survey the whole Baltic in the<br />
early 1990s, <strong>and</strong> in 1992 <strong>and</strong> 1993 the first coordinated<br />
census <strong>of</strong> the <strong>wintering</strong> waterbird populations<br />
<strong>of</strong> the entire Baltic was organized (Durinck<br />
et. al. 1994), for the first time producing distribution<br />
maps <strong>and</strong> population estimates for the Baltic<br />
Sea. A second survey <strong>of</strong> the entire Baltic was undertaken<br />
during 2007–2010, the SOWBAS project<br />
(Status <strong>of</strong> Wintering Waterbird Populations in the<br />
Baltic Sea; Skov et al. 2011).<br />
In the present contribution I summarize the re-<br />
39
sults <strong>of</strong> the SOWBAS project for Swedish waters<br />
including surveys in the Swedish Economic Zone<br />
<strong>of</strong> the Baltic Sea during 2010 <strong>and</strong> 2011 with the aim<br />
to develop a monitoring program for <strong>sea</strong>birds. The<br />
recent counts are compared with the population estimates<br />
based on modeling exercises from the first<br />
all-Baltic survey (Durinck et al. 1994) <strong>and</strong> regional<br />
estimates from the <strong>of</strong>fshore areas that were covered<br />
in the seventies (cf. Nilsson 1975, 1980). To make<br />
the picture more complete I also include a special<br />
survey <strong>of</strong> <strong>wintering</strong> Eiders Somateria mollissima<br />
<strong>and</strong> Scoters on the west coast in 2009.<br />
The species covered here are the <strong>of</strong>fshore species<br />
that are not properly covered by the regular midwinter<br />
counts in the inner coastal areas, i.e. longtailed<br />
Duck, Common Scoter Melanitta nigra, Velvet<br />
Scoter Melanitta fusca, Eider <strong>and</strong> Red-breasted<br />
Merganser Mergus serrator. The latter two species<br />
do also occur in inshore areas in such <strong>numbers</strong> that<br />
annual indices can be calculated but they also have<br />
important <strong>of</strong>fshore populations <strong>and</strong> are therefore<br />
included here. Other diving <strong>ducks</strong> considered as<br />
<strong>sea</strong><strong>ducks</strong> <strong>and</strong> occurring in Swedish waters are fully<br />
covered by the counts in inshore areas <strong>and</strong> will not<br />
be dealt with here see Nilsson (2008).<br />
Material <strong>and</strong> methods<br />
In the 2007–2011 survey the <strong>of</strong>fshore areas were<br />
covered by line transects from an aircraft. The census<br />
lines were laid out so that all important water<br />
areas (including the <strong>of</strong>fshore banks) in the Swedish<br />
part <strong>of</strong> the Baltic were covered out to a depth <strong>of</strong><br />
about 30 m. The survey lines started at the shore<br />
figure 1. Example <strong>of</strong> lines used for aerial surveys in Hanöbukten<br />
in south Sweden. Here the lines are 2 km apart but in<br />
the main areas we used 4 km between the survey lines. The<br />
shades <strong>of</strong> blue refer to depths <strong>of</strong>
ters, restricted to the innermost bays <strong>of</strong> the archipelagos.<br />
The 2010 winter was a contrast to 2009, being<br />
the coldest winter since 1987. The archipelagos got<br />
covered by ice early <strong>and</strong> at the time <strong>of</strong> the survey<br />
there was compact ice from the Stockholm archipelago<br />
to finl<strong>and</strong>. The major <strong>of</strong>fshore banks were<br />
surveyed during the winter but parts <strong>of</strong> the archipelagos<br />
could not be covered until the first days <strong>of</strong><br />
April. Coverage <strong>of</strong> the counts in 2010 is seen from<br />
figure 2.<br />
2011 was another cold winter with very cold<br />
weather already in December 2010. There was<br />
open water along the south coast in Scania, but the<br />
archipelagos from Kalmarsund in the south were<br />
totally frozen <strong>and</strong> there was only small areas <strong>of</strong><br />
open water in the outermost parts <strong>of</strong> the archipela-<br />
figure 2. Coverage <strong>of</strong> the aerial surveys in <strong>of</strong>fshore Swedish<br />
waters in the winters 2009, 2010 <strong>and</strong> 2011. Black lines =<br />
line transects, red dots = area-based counts. for ice cover in<br />
2011, see figur 3.<br />
Täckningen med flyginventeringar i svenska utsjöområden<br />
vintern 2009. Svarta linjer = linjetaxeringar, röda punkter =<br />
områdesbaserade inventeringar. För istäcke 2011, se Figur 3.<br />
gos north <strong>of</strong> Kalmarsund (figure 2). The ice extended<br />
east over the Baltic Sea <strong>and</strong> the important<br />
<strong>of</strong>fshore areas in the Baltic republics were all icecovered<br />
(figure 3).<br />
The southern parts <strong>of</strong> the Baltic could be covered<br />
during the winter proper, whereas the archipelagos<br />
further north could not be covered until<br />
the first days <strong>of</strong> April in some cases. This is <strong>of</strong> no<br />
problem for the long-tailed Ducks that leave the<br />
Baltic in May but the late surveys could not be<br />
used for the Eider <strong>and</strong> the Scoters. These species<br />
are however present in small <strong>numbers</strong> in these<br />
areas during the winter as shown by the countrywide<br />
surveys <strong>of</strong> the archipelagos. The <strong>of</strong>fshore<br />
surveys in 2009 were for some species supplemented<br />
by observations from the annual midwinter<br />
counts for some inshore areas (mainly on west<br />
41
Gotl<strong>and</strong>), which were not extensively covered by<br />
the aerial surveys.<br />
The efficiency <strong>of</strong> aerial surveys <strong>of</strong> different species<br />
was much studied during the seventies by air/<br />
ground comparisons for different species in different<br />
habitats (Nilsson 1975, cf. also Joensen 1974).<br />
In these studies marked differences in the survey<br />
efficiency was found between species but also between<br />
different observers as was also found for<br />
aerial surveys in the breeding areas (Haapanen &<br />
Nilsson 1979). The surveys during the seventies<br />
were area based, whereas the aerial surveys <strong>of</strong> the<br />
Swedish waters during the SOWBAS study were<br />
performed as line transects, so there might also be<br />
differences between the two kinds <strong>of</strong> aerial surveys.<br />
One possible source <strong>of</strong> bias applying to the line<br />
transects undertaken during 2007–2011 is the possibility<br />
to see if the flocks observed are within the<br />
main belt or not. The inclusion <strong>of</strong> flocks outside<br />
this belt in the calculations would lead to an overestimate<br />
<strong>of</strong> the number <strong>of</strong> <strong>sea</strong><strong>ducks</strong> in an area. On<br />
the other h<strong>and</strong> some birds will be missed during<br />
the counts as they may be under water during the<br />
passage <strong>of</strong> the aircraft. The earlier studies (Nilsson<br />
1975) did however establish that a relatively<br />
high proportion <strong>of</strong> the birds present in an area were<br />
actually seen from the aircraft during the passage.<br />
When comparing the estimates for Swedish waters<br />
presented here with the population estimates<br />
for NW Europe presented by Delany & Scott<br />
(2006) <strong>and</strong> with the two All Baltic surveys (Durinck<br />
et al. 1994, Skov et al. 2011) it is important<br />
to bear in mind the differences in methods used as<br />
well as the different uncertainties <strong>and</strong> biases attached<br />
to the two methods. These factors will also<br />
have great importance when evaluating the population<br />
changes indicated in the report from the SOW-<br />
BAS study (Skov et al. 2011).<br />
for the Swedish waters the estimates presented<br />
here <strong>and</strong> included in the SOWBAS report (Skov<br />
et al. 2011) are all based on aerial line transects,<br />
whereas no aerial surveys could be undertaken<br />
during the 1992/1993 study. The estimates for<br />
Swedish waters in 1992/1993 were based on relatively<br />
few ship transects in some <strong>of</strong>fshore areas,<br />
whereas many areas were very poorly covered<br />
with transects lines (see Durinck et al. 1994, map<br />
4, for coverage), the estimates to a large extent<br />
being based on modeling exercises. The regional<br />
estimates from 1992/1993 presented in the tables<br />
are therefore considered to be imprecise. The overall<br />
estimates for the Baltic in the SOWBAS study<br />
were also based on modeling (Skov et al. 2011),<br />
42<br />
whereas the estimates presented here are based on<br />
the totals from the line transects adjusted for coverage<br />
with the expansion factors presented above.<br />
The overall Baltic survey in 1992/1993 included<br />
aerial surveys in some <strong>of</strong> the other countries<br />
but did rely heavily on boat transects for the <strong>of</strong>fshore<br />
areas. As there are very marked differences<br />
in methods <strong>and</strong> coverage for the Swedish waters<br />
(<strong>and</strong> some other areas) between the two all Baltic<br />
surveys, the estimates from this survey must be regarded<br />
with large caution.<br />
for the long-tailed Duck, estimates are also<br />
presented for the period 1966–1974. for the areas<br />
in Scania <strong>and</strong> Blekinge these are based on line<br />
transects from patrol boats <strong>of</strong> the Swedish Coastguard.<br />
Details for these surveys including survey<br />
lines were published by Nilsson (1980). These<br />
counts were considered to cover 500 m on each<br />
side <strong>of</strong> the ship, based on which mean densities<br />
were calculated for different sectors. The densities<br />
were assumed to apply for areas out to 20 m<br />
depth. Estimates for the east <strong>and</strong> north coasts <strong>of</strong><br />
Öl<strong>and</strong> <strong>and</strong> for the areas east <strong>and</strong> north <strong>of</strong> Gotl<strong>and</strong><br />
were based on an aerial survey in 1974 <strong>and</strong> density<br />
estimates from line transects by boats. In the calculations<br />
the aerial survey was considered to cover<br />
250 m on each side <strong>of</strong> the aircraft. The densities<br />
obtained from the boat surveys <strong>and</strong> aerial surveys<br />
were used to get a rough estimate for the total <strong>wintering</strong><br />
populations based on the experiences <strong>of</strong> the<br />
distribution <strong>of</strong> long-tailed Ducks from later more<br />
extensive surveys. Early estimates for the archipelagos<br />
from northern Kalmar to Stockholm were<br />
based on total surveys <strong>of</strong> the areas <strong>and</strong> have been<br />
published by Nilsson (1975).<br />
Results<br />
Long-tailed Duck Clangula hyemalis<br />
The long-tailed Duck is mainly restricted to the<br />
Baltic during the winter <strong>and</strong> only very small <strong>numbers</strong><br />
are found on the west coast. The species is<br />
distributed from falsterbo in the southwest to<br />
finngrunden in Gävlebukten to the north (figure<br />
3). The absolute majority <strong>of</strong> the long-tailed Ducks<br />
in Swedish waters in 2009 were found on the three<br />
<strong>of</strong>fshore banks: Hoburg bank, N. Midsjö bank <strong>and</strong><br />
S. Midsjö bank. In all 300 000 out <strong>of</strong> an estimated<br />
total for the Swedish waters <strong>of</strong> 436 000 in this winter<br />
were found here (figure 3, 4, Table 1, 2).<br />
Besides the three large <strong>of</strong>fshore banks, important<br />
<strong>numbers</strong> <strong>of</strong> long-tailed Ducks were also found on<br />
the east coast <strong>of</strong> Gotl<strong>and</strong> <strong>and</strong> around Öl<strong>and</strong> (figure<br />
3, Table 1). The areas north <strong>of</strong> Gotl<strong>and</strong> were
figure 3. The distribution <strong>of</strong> long-tailed Duck Clangula<br />
hyemalis in Swedish waters in the mild winter 2009 <strong>and</strong> the<br />
cold ice-winter 2011. The red line = border <strong>of</strong> ice.<br />
Utbredningen för alfågel Clangula hyemalis i svenska farvatten<br />
den milda vintern 2009 och den kalla isvintern 2011.<br />
Röd linje = isgränsen.<br />
not surveyed in 2009 but important <strong>numbers</strong> were<br />
found here in other years. On the mainl<strong>and</strong> coast<br />
only small <strong>numbers</strong> were counted on the south<br />
coast <strong>of</strong> Scania, <strong>and</strong> larger flocks from Hanöbukten<br />
<strong>and</strong> Kalmarsund north to Stockholm in the outer<br />
zone <strong>of</strong> the archipelagos (figure 3).<br />
In the two winters <strong>of</strong> 2010 <strong>and</strong> 2011, with hard<br />
ice conditions, the distribution <strong>of</strong> the long-tailed<br />
Duck in Sweden was markedly different. large<br />
<strong>numbers</strong> were concentrated to the <strong>of</strong>fshore banks,<br />
with an estimated total there <strong>of</strong> 630 000 in 2010 <strong>and</strong><br />
365 000 in 2011. In 2010 426 000 <strong>of</strong> these longtailed<br />
Ducks were found on Hoburgbank (Table 1,<br />
figure 4). The high counts on the <strong>of</strong>fshore banks in<br />
2010 <strong>and</strong> 2011 can most probably be related to the<br />
ice situation, especially on the eastern Baltic coast,<br />
where the important winter areas for the species<br />
1600000<br />
1400000<br />
1200000<br />
1000000<br />
800000<br />
600000<br />
400000<br />
200000<br />
0<br />
Other areas<br />
Hoburgs Bank<br />
Midsjö Banks<br />
1993 2009 2010 2011<br />
figure 4. The estimated population <strong>of</strong> long-tailed Duck<br />
Clangula hyemalis on the <strong>of</strong>fshore banks <strong>and</strong> in other Swedish<br />
areas during the surveys in 1992/93, 2009, 2010 <strong>and</strong><br />
2011.<br />
Det beräknade beståndet av alfågel Clangula hyemalis på<br />
de viktiga utsjöbankarna och <strong>and</strong>ra svenska områden vid<br />
inventeringarna 1992/93, 2009, 2010 och 2011.<br />
such as Irbe strait <strong>and</strong> the Riga bay were totally<br />
ice-covered in 2010 <strong>and</strong> 2011.<br />
The occurrence <strong>of</strong> long-tailed Ducks on the<br />
three major <strong>of</strong>fshore banks will be further discussed<br />
in another context, so I will not go into any<br />
details here. On Hoburgbank marked differences<br />
were found between the three years, related to the<br />
ice situation in the Baltic. On the Midsjö banks on<br />
the other h<strong>and</strong> the totals found in 2009 <strong>and</strong> 2010<br />
were largely similar, but <strong>numbers</strong> were appreciably<br />
lower in 2011. The northern Midsjö bank however<br />
had similar totals for all three years (Table 2).<br />
Compared to the first total survey <strong>of</strong> the Baltic<br />
<strong>sea</strong> in 1992/1993 there were marked differences in<br />
the total number <strong>of</strong> long tailed Ducks estimated<br />
for the Swedish part <strong>of</strong> the Baltic in the two censuses,<br />
1.41 million in the former compared to 0.44<br />
million in 2009. The two estimates are however<br />
based on different methods with different kinds <strong>of</strong><br />
bias, as discussed above.<br />
The changes between the two major surveys are<br />
not the same for all areas. for the main areas around<br />
Gotl<strong>and</strong>, Hoburgbank <strong>and</strong> the Midsjö banks, very<br />
marked differences were found between 1992/1993<br />
<strong>and</strong> 2009. Estimates for Hoburgbank were 90 000<br />
in 2009 compared to 925 000 in 1992/1993. for the<br />
east coast <strong>of</strong> Gotl<strong>and</strong> the estimates for the two surveys<br />
were 11 000 compared to 270 000. Numbers<br />
on the Midsjö banks were markedly higher in 2009<br />
than in 1992/1993 but this does not compensate<br />
for the decrease on Hoburgbank. Counts in 2009<br />
<strong>and</strong> 2010 were similar but <strong>numbers</strong> were markedly<br />
lower on the southern Midsjö bank in 2011 than in<br />
the two previous years (Table 2) but there was no<br />
43
Table 1. Estimated totals <strong>of</strong> long-tailed Ducks Clangula hyemalis in different areas along the Baltic coast <strong>of</strong><br />
Sweden. <strong>Distribution</strong> maps 2009 <strong>and</strong> 2011 in figure 3; lack <strong>of</strong> agreement between table <strong>and</strong> map depends on<br />
superimposition <strong>of</strong> dots <strong>and</strong> different division into sections. A dash indicates absence <strong>of</strong> count.<br />
Beräknat antal alfåglar Clangula hyemalis inom olika delområden på den svenska kusten vid olika tillfällen.<br />
Utbredningskartor 2009 och 2011 i Figur 3; brist på överensstämmelse mellan tabell och karta beror på att<br />
punkter ligger på var<strong>and</strong>ra och att områdesindelningen är olika. Ett streck anger avsaknad av räkning.<br />
Area 1967–74 1992–93 2007 2009 2010 2011<br />
falsterbo 1400 500 – 1600 2800 1200<br />
Skåne south coast 9000 800 – 1700 – 2000<br />
Skåne southeast 7000 200 – 100 – 300<br />
Hanöbukten 25000 17000 23000 17000 – 7100<br />
Blekinge archipelago 1600 1100 300 100 – 100<br />
Kalmarsund – 12000 23000 11000 11500 2500<br />
Öl<strong>and</strong> east coast 40000 10000 19000 26000 – 39000<br />
Öl<strong>and</strong> North banks 60000 30000 11000 5000 7200 22400<br />
Midsjö banks – 81000 – 213000 206000 85000<br />
Hoburgs bank – 925000 – 90000 426000 280000<br />
Gotl<strong>and</strong> east coast 400000 270000 – 11000 15100 15700<br />
Gotl<strong>and</strong> north 20000 10000 – 13500 14500<br />
Gotl<strong>and</strong> west – 23000 – 2000 – 2000<br />
Kalmar archipelago 10000 12000 – 14000 2700 ICE<br />
Östergötl<strong>and</strong> archipelago 1000 3500 – 8800 3200 ICE<br />
Södermanl<strong>and</strong> archipelago 4000 4000 – 4100 12000 ICE<br />
Stockholm archipelago 24000 18000 – 26100 – ICE<br />
Uppl<strong>and</strong> coast – – – 3700 – ICE<br />
Gävlebukten – – – 600 – ICE<br />
Total 1418100 435800 471800<br />
similar decrease on the northern bank.<br />
The <strong>of</strong>fshore areas around Gotl<strong>and</strong> could not be<br />
covered properly during the 1970s even if some<br />
boat transects were made along the east coast. In<br />
the winter 1974 an aerial survey was made along<br />
the entire east coast <strong>of</strong> Gotl<strong>and</strong>. 26 000 long-tailed<br />
Ducks were actually counted. Taking the coverage<br />
<strong>and</strong> the experiences from later aerial surveys here<br />
into consideration it is probable that the total <strong>wintering</strong><br />
number <strong>of</strong> long-tailed Ducks here was in the<br />
order <strong>of</strong> 200 000–400 000. The estimates for these<br />
waters in 2009–2011 were 11 000–15 700. It is clear<br />
that there has been a marked decrease in the waters<br />
east <strong>and</strong> north <strong>of</strong> Gotl<strong>and</strong>.<br />
44<br />
from the mainl<strong>and</strong> coast <strong>and</strong> the archipelagos<br />
fairly extensive data on the long-tailed Ducks are<br />
available from the period 1971–1974 (1978). There<br />
are also some longer count series from areas where<br />
the long-tailed Ducks can be counted more or less<br />
accurately from the shore. Regular counts <strong>of</strong> <strong>wintering</strong><br />
<strong>ducks</strong> have been made on the coasts <strong>of</strong> south<br />
Scania between Ystad <strong>and</strong> falsterbo Canal every<br />
winter since 1964. The depth pr<strong>of</strong>ile makes it possible<br />
to cover an important part <strong>of</strong> the areas used by<br />
the long-tailed Ducks in a st<strong>and</strong>ardized manner.<br />
During the first years more than 1000 long-tailed<br />
Ducks were regularly counted here in January (figure<br />
5) but <strong>numbers</strong> have decreased markedly over<br />
Table 2. Total estimated number <strong>of</strong> long-tailed Ducks Clangula hyemalis on the Midsjö banks at all aerial surveys<br />
in the area. A dash indicates absence <strong>of</strong> count.<br />
Beräknat antal alfåglar Clangula hyemalis på Midsjöbankarna vid genomförda flyginventeringar. Ett streck<br />
anger avsaknad av räkning.<br />
2005-04-01 2009-03-03 2010-03-16 2011-03-07 2011-03-29 2011-04-20<br />
Norra – 76000 74000 63000 37000 67000<br />
Södra 160000 137000 132000 22000 7500 16500<br />
Total 213000 206000 85000 44500 83500
the years. The same was noted for the archipelago<br />
<strong>of</strong> Blekinge (figure 5). On the other h<strong>and</strong> there<br />
were no major changes in the number <strong>of</strong> <strong>wintering</strong><br />
long-tailed Ducks in Hanöbukten (Table 1),<br />
although the estimated total <strong>of</strong> long-tailed Ducks<br />
here varied between 23 000 <strong>and</strong> 7100 at the different<br />
surveys in 2007–2011.<br />
Kalmarsund was not well covered in the 1970s<br />
so there are no total estimates available. The estimates<br />
for 1929/1993, 2009 <strong>and</strong> 2010 were similar<br />
whereas many more long-tailed Ducks were estimated<br />
here for 2007. Only few were counted here<br />
in 2011 as most <strong>of</strong> the area was ice-covered.<br />
The east <strong>and</strong> north coast <strong>of</strong> Öl<strong>and</strong> is an important<br />
area for the long-tailed Duck. The 1992/1993<br />
survey estimated the <strong>numbers</strong> here to about<br />
40 000, the estimates for 2007 <strong>and</strong> 2009 being around<br />
30 000 (Table 1). In the ice winter 2011 the estimate<br />
for these areas was about 60 000 but the entire<br />
Kalmarsund <strong>and</strong> the archipelagos were ice-covered<br />
<strong>and</strong> the long-tailed Ducks had probably concentrated<br />
to the waters around Öl<strong>and</strong>. from the surveys<br />
in the period 1971–1974 the estimated total<br />
for east <strong>and</strong> north Öl<strong>and</strong> waters is in the order <strong>of</strong><br />
100 000 individuals. Regular shore-bound counts<br />
in January show a marked variation in the <strong>numbers</strong><br />
<strong>of</strong> long-tailed Ducks counted on the coasts<br />
<strong>of</strong> northern Öl<strong>and</strong> between different years without<br />
any trend (figure 5), but the counts are much influenced<br />
by the weather conditions.<br />
Estimates from 1971–1974 are available from<br />
the archipelagos from Kalmar to Stockholm (Table<br />
1) showing no differences in the estimated <strong>numbers</strong><br />
<strong>of</strong> <strong>wintering</strong> long-tailed Ducks here comparing<br />
with the recent survey in 2009 (these areas being<br />
ice-covered in 2010 <strong>and</strong> 2011). The coast <strong>of</strong><br />
Väddö on the Uppl<strong>and</strong> coast north <strong>of</strong> Stockholm<br />
archipelago showed marked variation between different<br />
years (figure 5).<br />
The local distribution <strong>of</strong> long-tailed Ducks in<br />
some areas will be discussed in some detail here<br />
as the surveys in 2007–2011 were the first ones<br />
to obtain a comprehensive coverage <strong>of</strong> the entire<br />
<strong>of</strong>fshore distribution in Swedish waters. The south<br />
figure 5. Annual totals <strong>of</strong> long-tailed Ducks Clangula hyemalis<br />
in four reference areas <strong>of</strong> the International Midwinter<br />
Counts during 1971–2011.<br />
Antalet alfåglar Clangula hyemalis inom fyra referensområden<br />
vid de internationella midvinterinventeringarna<br />
1971–2011.<br />
3000<br />
2500<br />
2000<br />
1500<br />
1000<br />
500<br />
3500<br />
3000<br />
2500<br />
2000<br />
1500<br />
1000<br />
South coast <strong>of</strong> Scania<br />
0<br />
1971 1974 1977 1980 1983 1986 1989 1992 1995 1998 2001 2004 2007 2010<br />
500<br />
Blekinge archipelago<br />
0<br />
1971 1974 1977 1980 1983 1986 1989 1992 1995 1998 2001 2004 2007 2010<br />
25000<br />
20000<br />
15000<br />
10000<br />
5000<br />
12000<br />
10000<br />
8000<br />
6000<br />
4000<br />
2000<br />
N Öl<strong>and</strong><br />
0<br />
1970 1973 1976 1979 1982 1985 1988 1991 1994 1997 2000 2003 2006 2009<br />
Väddö<br />
No counts 1980<br />
-‐ 1986, 1993<br />
0<br />
1971 1974 1977 1980 1983 1986 1989 1992 1995 1998 2001 2004 2007 2010<br />
45
figure 6. Number <strong>of</strong> long-tailed Ducks Clangula hyemalis<br />
counted along the line transects <strong>of</strong>f the south coast <strong>of</strong> Scania,<br />
southernmost Sweden during the winters 2007, 2009 <strong>and</strong><br />
2011. Black lines = transect lines.<br />
Antalet inräknade alfåglar Clangula hyemalis längs inventeringslinjer<br />
utanför den skånska sydkusten, södra Sverige,<br />
under vintrarna 2007, 2009 och 2011. Svarta linjer = inventeringslinjer.<br />
coast <strong>of</strong> Scania has been surveyed completely from<br />
the air on three occasions during 2007–2011 (figure<br />
6). In the southern part <strong>of</strong> Öresund <strong>and</strong> around<br />
the falsterbo peninsula, where detailed studies<br />
have been made (Nilsson & Green 2011) small<br />
groups <strong>of</strong> long-tailed Ducks were found spread<br />
in the <strong>of</strong>fshore areas. The long-tailed Ducks were<br />
found spread <strong>of</strong>f the entire south coast mostly in<br />
rather shallow waters relatively close to the shore<br />
even if flocks were found out to a depth <strong>of</strong> about<br />
20 m. The distribution was similar during extensive<br />
boat surveys <strong>and</strong> counts from the shore during<br />
1964–1970 (Nilsson 1972), but <strong>numbers</strong> in the<br />
area were much lower in 2007–2009 both in the<br />
<strong>of</strong>fshore <strong>and</strong> inshore waters (figure 5).<br />
Hanöbukten in Scania is the southernmost <strong>of</strong>fshore<br />
concentration area for the species in Sweden.<br />
Three surveys in 2007–2011 (figure 7) show quite<br />
different distribution patterns. In 2007 they were<br />
highly spread out over the entire area, whereas they<br />
46<br />
figure 7. Number <strong>of</strong> long-tailed Ducks Clangula hyemalis<br />
counted along the line transects in Hanöbukten, southernmost<br />
Sweden during the winters 2007, 2009 <strong>and</strong> 2011. Black<br />
lines = transect lines.<br />
Antalet inräknade alfåglar Clangula hyemalis längs inventeringslinjer<br />
i Hanöbukten, södra Sverige, under vintrarna<br />
2007, 2009 och 2011. Svarta linjer = inventeringslinjer.<br />
were much more concentrated in 2009. The totals<br />
estimated for the two surveys were not so different,<br />
23 000 compared to 17 000, whereas much lower<br />
counts were obtained in 2011 (Table 1). The 2009<br />
concentration was at a shallow area called Kiviksbredan,<br />
which had the highest densities <strong>of</strong> longtailed<br />
Ducks during studies in the 1960s (Nilsson
figure 8. Number <strong>of</strong> long-tailed Ducks Clangula hyemalis counted along the line transects in Kalmarsund <strong>and</strong> <strong>of</strong>f Öl<strong>and</strong>,<br />
southernmost Sweden during the winters 2007, 2009 <strong>and</strong> 2011. Black lines = transect lines.<br />
Antalet inräknade alfåglar Clangula hyemalis längs inventeringslinjer i Kalmarsund och utanför Öl<strong>and</strong>, södra Sverige,<br />
under vintrarna 2007, 2009 och 2011. Svarta linjer = inventeringslinjer.<br />
1972) but in most other surveys the species was<br />
more spread out than in the earlier years.<br />
Kalmarsund <strong>and</strong> Öl<strong>and</strong> were totally covered in<br />
three winters (figure 8). 2007 <strong>and</strong> 2009 were mild<br />
winters with little ice <strong>and</strong> accordingly the longtailed<br />
Ducks were well spread both in the Kalmarsund<br />
<strong>and</strong> on the east <strong>and</strong> north coast <strong>of</strong> Öl<strong>and</strong>. 2011<br />
was a hard ice-winter <strong>and</strong> the only open water in<br />
the Kalmarsund was found in the far southern end<br />
<strong>of</strong> the area. In this winter the long-tailed Ducks<br />
were found east <strong>and</strong> northeast <strong>of</strong> Öl<strong>and</strong>, with an<br />
estimated total <strong>of</strong> 60 000 individuals in this area<br />
(Table 1).<br />
In all years concentrations <strong>of</strong> long-tailed Ducks<br />
were found on the banks north <strong>and</strong> northeast <strong>of</strong><br />
Öl<strong>and</strong>. large <strong>numbers</strong> were <strong>of</strong>ten counted from the<br />
shore in this area (figure 5). In two <strong>of</strong> the three surveys<br />
there was also a concentration <strong>of</strong> long-tailed<br />
Ducks around southern Öl<strong>and</strong>. In the Kalmarsund<br />
there are a number <strong>of</strong> shallow banks in the southern<br />
<strong>and</strong> northern parts <strong>of</strong> the area <strong>and</strong> most flocks<br />
<strong>of</strong> long-tailed Ducks were accordingly found here.<br />
The distribution <strong>of</strong> long-tailed Ducks in the waters<br />
around Öl<strong>and</strong> was similar in the seventies with a<br />
marked concentration to the northern banks <strong>and</strong> the<br />
northeastern coast <strong>of</strong> the isl<strong>and</strong>.<br />
long-tailed Ducks were wide-spread in the outer<br />
zones <strong>of</strong> the archipelagos all the way from the<br />
Kalmarsund area to the northern part <strong>of</strong> the Stockholm<br />
archipelago (figure 9). In the 2009 survey<br />
there were no larger regional differences with the<br />
exception <strong>of</strong> few long-tailed Ducks in the southern<br />
part <strong>of</strong> the Stockholm archipelago. The inner parts<br />
<strong>of</strong> the archipelago were not covered in the 2009<br />
survey, but counts at the countrywide aerial survey<br />
in 2004 did not show any larger <strong>numbers</strong> <strong>of</strong> longtailed<br />
Ducks here. The distribution <strong>of</strong> long-tailed<br />
<strong>ducks</strong> in the archipelagos was similar in the surveys<br />
during the 1970s.<br />
The best coverage <strong>of</strong> the <strong>of</strong>fshore waters around<br />
Gotl<strong>and</strong> was obtained in the ice winter 2011 (figure<br />
10). The species was well spread mostly in<br />
smaller groups <strong>and</strong> some flocks on the east coast<br />
<strong>and</strong> on the banks between mainl<strong>and</strong> Gotl<strong>and</strong> <strong>and</strong><br />
Gotska S<strong>and</strong>ön with a flock on the isolated <strong>of</strong>fshore<br />
bank Kopparstenarna. A concentration was found<br />
at Östergarn <strong>and</strong> some parts at Gotska S<strong>and</strong>ön. The<br />
counts <strong>of</strong> the east coast <strong>of</strong> Gotl<strong>and</strong> in 2009 <strong>and</strong><br />
2010 show a similar distribution <strong>of</strong> the species but<br />
all parts were not covered. In the 1970s very large<br />
<strong>numbers</strong> <strong>of</strong> long-tailed Ducks were found in the<br />
waters around fårön <strong>and</strong> the northeast <strong>of</strong> Gotl<strong>and</strong>,<br />
but during the recent surveys only relatively small<br />
<strong>numbers</strong> were found here. The situation for the<br />
long-tailed Ducks on Hoburg bank <strong>and</strong> the Midsjö<br />
banks will be addressed in another paper analyzing<br />
47
figure 9. Number <strong>of</strong> long-tailed Ducks Clangula hyemalis<br />
counted along the line transects in east coast archipelagos <strong>of</strong><br />
Sweden during the winter 2009. Black lines = transect lines.<br />
Antalet inräknade alfåglar Clangula hyemalis längs inventeringslinjer<br />
i de svenska ostkustskärgårdarna under vintern<br />
2009. Svarta linjer = inventeringslinjer<br />
48<br />
figure 10. Number <strong>of</strong> long-tailed Ducks Clangula hyemalis<br />
counted along the line transects at the coasts <strong>of</strong> Gotl<strong>and</strong><br />
during the winter 2011. Black lines = transect lines.<br />
Antalet inräknade alfåglar Clangula hyemalis längs inventeringslinjer<br />
vid kusterna av Gotl<strong>and</strong> under vintern 2011.<br />
Svarta linjer = inventeringslinjer<br />
the distribution <strong>of</strong> the species in relation to different<br />
habitat features (larsson, Nilsson & Skov in<br />
prep.) but maps <strong>of</strong> the distribution on these banks<br />
from the 2009 survey are included here to make the<br />
overall picture complete (figure 11).<br />
Velvet Scoter Melanitta fusca<br />
The Velvet Scoter is normally seen only in relatively<br />
small <strong>numbers</strong> in the Swedish part <strong>of</strong> the Baltic<br />
(figure 12, Table 3). In 2007, when unusually high<br />
<strong>numbers</strong> <strong>of</strong> Common Scoters were found in parts<br />
<strong>of</strong> the Swedish Baltic, relatively high <strong>numbers</strong> <strong>of</strong><br />
Velvet Scoters were also counted in Hanöbukten<br />
<strong>and</strong> along the east coast <strong>of</strong> Öl<strong>and</strong>. Offshore counts<br />
in the waters around falsterbo <strong>and</strong> in Hanöbukten<br />
have shown a regular occurrence <strong>of</strong> the species in
figure 11. Number <strong>of</strong> long-tailed Ducks Clangula hyemalis<br />
counted along the line transects on Hoburg Bank southeast<br />
<strong>of</strong> Gotl<strong>and</strong> (upper map) <strong>and</strong> on the Midsjö banks southeast<br />
<strong>of</strong> Öl<strong>and</strong> (lower map) during the winter 2009. Black lines =<br />
transect lines.<br />
Antalet inräknade alfåglar Clangula hyemalis längs inventeringslinjer<br />
på Hoburgs Bank sydost om Gotl<strong>and</strong> (övre kartan)<br />
och Midsjöbankarna sydost om Öl<strong>and</strong> (nedre kartan)<br />
vintern 2009. Svarta linjer = inventeringslinjer.<br />
small <strong>numbers</strong> in the winter, small <strong>numbers</strong> also<br />
occurring around Öl<strong>and</strong> <strong>and</strong> Gotl<strong>and</strong> (cf. Nilsson<br />
1972, 1975, 2008, Nilsson & Green 2011).<br />
In the southeastern part <strong>of</strong> Kattegatt, in laholmsbukten<br />
<strong>and</strong> Skälderviken, Velvet Scoters <strong>and</strong><br />
Common Scoters are regularly <strong>wintering</strong> in flocks<br />
(figure 11, Table 4). The areas are regularly covered<br />
during the st<strong>and</strong>ard midwinter counts, but the<br />
flocks stay too far out from the shore to be ade-<br />
figure 12. The distribution <strong>of</strong> Velvet Scoter Melanitta fusca<br />
in Swedish waters in the mild winter 2009.<br />
Utbredningen för svärta Melanitta fusca i svenska farvatten<br />
den milda vintern 2009.<br />
quately covered every winter. Scoter flocks have<br />
however been recorded here since the start <strong>of</strong> the<br />
counts in the 1960s (Nilsson 1975). In 2009, this<br />
area was surveyed from the air <strong>and</strong> the total number<br />
<strong>of</strong> <strong>wintering</strong> Velvet Scoters was estimated to be<br />
around 2500, compared to about 17 500 Common<br />
Scoters (Table 4, unidentified Scoters included in<br />
proportion to identified ones).<br />
Common Scoter Melanitta nigra<br />
The Common Scoter is a regular <strong>wintering</strong> bird in<br />
the southern part <strong>of</strong> the Swedish Baltic areas <strong>and</strong><br />
in the southeast parts <strong>of</strong> the Kattegat (figure 13).<br />
Normally it has been counted in relatively small<br />
<strong>numbers</strong> around the coasts <strong>of</strong> Scania, Kalmarsund<br />
<strong>and</strong> Öl<strong>and</strong>, but in 2007 no less that 40 000 Common<br />
Scoters were estimated to be present in the<br />
<strong>of</strong>fshore waters here compared to 1500–2000 in the<br />
other years (Table 5). Numbers were much lower<br />
in 2009 but a flock <strong>of</strong> no less than 600 was found<br />
on northern Gotl<strong>and</strong> during the midwinter counts<br />
from the shore (Gotl<strong>and</strong> was not covered in 2007).<br />
The Common Scoter as well as the Velvet Scoter<br />
is regularly <strong>wintering</strong> in the southeast part <strong>of</strong> the<br />
Kattegat (figure 13, Table 4). At the aerial surveys<br />
in 2009, the total number <strong>of</strong> Common Scoters in<br />
this area was estimated to be about 17 500. The annual<br />
midwinter counts in this region do not cover<br />
the <strong>of</strong>fshore parts properly, but large flocks <strong>of</strong> <strong>wintering</strong><br />
Common Scoters have been regularly seen<br />
since the start <strong>of</strong> the counts in the late sixties (Nilsson<br />
1975, 2008).<br />
49
Table 3. Estimated totals <strong>of</strong> Velvet Scoters Melanitta fusca in different areas along the Swedish Baltic coast in<br />
the winters 2007–2011. <strong>Distribution</strong> map for 2009 in figure 12; further explanation in Table 1. A dash indicates<br />
absence <strong>of</strong> count.<br />
Skattat antal svärta Melanitta fusca inom olika områden efter den svenska Östersjökusten 2007 och 2009. Utbredningskarta<br />
i Figur 12; ytterligare förklaring i Tabell 1. Ett streck anger avsaknad av räkning.<br />
Area 2007 2009 2010 2011<br />
falsterbo 180 0 250 90<br />
Skåne south coast 10 0 – 0<br />
Skåne southeast – 0 – 0<br />
Hanöbukten 3240 60 – 330<br />
Blekinge archipelago 0 0 – 0<br />
Kalmarsund 870 30 325 13<br />
Öl<strong>and</strong> east coast 1850 0 – 0<br />
Öl<strong>and</strong> North banks 0 0 0 0<br />
Midsjöbankarna – 0 0 0<br />
Hoburg Bank – 0 0 350<br />
Gotl<strong>and</strong> east coast – 20 – 1075<br />
Gotl<strong>and</strong> north – – – 0<br />
Gotl<strong>and</strong> west – 100 – –<br />
Kalmar archipelago – – – ICE<br />
Östergötl<strong>and</strong> archipelago – – – ICE<br />
Södermanl<strong>and</strong> archipelago – – – ICE<br />
Stockholm archipelago – – – ICE<br />
Uppl<strong>and</strong> coast – – – ICE<br />
Gävlebukten – – – ICE<br />
Total 6150 210 1858<br />
The local distribution <strong>of</strong> the Common Scoter in<br />
Hanöbukten is exemplified in figure 14. In 2007,<br />
when the <strong>wintering</strong> population here was estimated<br />
to be around 13 500, the majority <strong>of</strong> the Common<br />
Scoters occurred far out at <strong>sea</strong> <strong>of</strong>ten at a water<br />
depth <strong>of</strong> about 20 m or more.<br />
The Common Scoter has been seen in small<br />
<strong>numbers</strong> in the archipelagos <strong>of</strong> the Swedish Baltic<br />
coast in winter. The surveys in 2009, which were<br />
timed for covering the long-tailed Ducks, were too<br />
late for Scoters (<strong>and</strong> Eiders) as the spring migration<br />
for these species had already started.<br />
Table 4. Estimated totals for Common Scoter Melanitta<br />
nigra <strong>and</strong> Velvet Scoter Melanitta fusca in Skälderviken<br />
<strong>and</strong> laholmsbukten in the winter 2009.<br />
Räknat och skattat bestånd för sjöorre Melanitta<br />
nigra och svärta Melanitta fusca i Skälderviken och<br />
Laholmsbukten vintern 2009.<br />
Species Skälderviken laholmsbukten<br />
Common Scoter Melanitta nigra 4500 11000<br />
Velvet ScoterMelanitta fusca 1320 1120<br />
Melanitta sp. 750 1310<br />
Total 6580 13430<br />
50<br />
Eider Somateria mollisima<br />
Wintering Eiders are mostly found on the west<br />
coast <strong>of</strong> Sweden (figure 15, Table 6). During the<br />
more or less complete count in 2009, about 52 000<br />
were counted on the west coast (Table 7) <strong>and</strong> about<br />
20 000 on the east coast (Table 6). The majority<br />
<strong>of</strong> the <strong>wintering</strong> Eiders in the Baltic were found<br />
in two areas, around the falsterbo peninsula in the<br />
southwest <strong>and</strong> around Gotl<strong>and</strong> (figure 15, Table<br />
6). Only smaller <strong>numbers</strong> were found in the other<br />
parts <strong>of</strong> the Baltic coast in winter. The 2009 survey<br />
was undertaken too late for counting <strong>of</strong> <strong>wintering</strong><br />
Eiders in the archipelagos (migration had started),<br />
but only small <strong>numbers</strong> were found in the 2004 inshore<br />
survey, which had a good coverage <strong>of</strong> potential<br />
Eider sites in the archipelagos.<br />
On the west coast, the Eider is well spread over<br />
the entire area from northern Öresund <strong>and</strong> Skälderviken<br />
in the south to the Norwegian border (figure<br />
16). In the Kattegat the Eiders are mostly found<br />
inshore, but in Bohuslän the majority <strong>of</strong> the Eiders<br />
were found close to the outer isl<strong>and</strong>s <strong>and</strong> skerries,<br />
mostly on the western shores <strong>of</strong> small isl<strong>and</strong>s with<br />
rich supplies <strong>of</strong> blue mussels.
figure 13. The distribution <strong>of</strong> Common Scoter Melanitta<br />
nigra in Swedish waters in the mild winter 2009.<br />
Utbredningen för sjöorre Melanitta nigra i svenska farvatten<br />
den milda vintern 2009.<br />
Table 5. Estimated totals <strong>of</strong> Common Scoters Melanitta<br />
nigra in different areas along the Swedish Baltic<br />
coast in the winters 2007–2011. <strong>Distribution</strong> map<br />
for 2009 in figure 13; futher explanation in Table 1. A<br />
dash indicates absence <strong>of</strong> count.<br />
Skattat antal sjöorrar Melanitta nigra inom olika områden<br />
efter den svenska Östersjökusten 2007–2011.<br />
Utbredningskarta för 2009 i Figur 13; ytterligare<br />
förklaring i Tabell 1. Ett streck anger avsaknad av<br />
räkning.<br />
figure 14. Number <strong>of</strong> Common Scoters Melanitta nigra<br />
counted along the line transects in Hanöbukten, southernmost<br />
Sweden during the winters 2007 <strong>and</strong> 2009. Black lines<br />
= transect lines.<br />
Antalet inräknade sjöorrar Melanitta nigra längs inventeringslinjer<br />
i Hanöbukten, södra Sverige, under vintrarna<br />
2007 och 2009. Svarta linjer = inventeringslinjer.<br />
Area 2007 2009 2010 2011<br />
falsterbo 2100 470 300 375<br />
Skåne south coast 500 430 – 0<br />
Skåne southeast – – – 0<br />
Hanöbukten 13500 300 – 238<br />
Blekinge archipelago 0 0 – 0<br />
Kalmarsund 20600 60 150 25<br />
Öl<strong>and</strong> east coast 3200 560 – 500<br />
Öl<strong>and</strong> North banks 0 0 0 0<br />
Midsjöbankarna – 0 63 0<br />
Hoburg Bank – 40 2110 338<br />
Gotl<strong>and</strong> east coast – 20 – 25<br />
Gotl<strong>and</strong> north – 600 – 0<br />
Gotl<strong>and</strong> west – 20 – –<br />
Kalmar archipelago – – – ICE<br />
Östergötl<strong>and</strong> archipelago – – – ICE<br />
Södermanl<strong>and</strong> archipelago – – – ICE<br />
Stockholm archipelago – – – ICE<br />
Uppl<strong>and</strong> coast – – – ICE<br />
Gävlebukten – – – ICE<br />
Total 39900 2500 1501<br />
51
figure 15. The distribution <strong>of</strong> Eider Somateria mollissima in<br />
Swedish waters in the mild winter 2009.<br />
Utbredningen för ejder Somateria mollissima i svenska farvatten<br />
den milda vintern 2009.<br />
The Eiders <strong>wintering</strong> on the west coast have been<br />
surveyed from the air during four periods (Table 7).<br />
At the first two surveys less than 10 000 <strong>wintering</strong><br />
Eiders were found but from 1987–1989 to 2004 the<br />
number increased to 48 300 with no large changes<br />
to 2009 when 52 000 were counted here.<br />
52<br />
Table 7. Estimated totals <strong>of</strong> Eiders Somateria mollissima on<br />
the west coast in the four periods when aerial surveys were<br />
undertaken here (additional data from ground counts also<br />
included).<br />
Beräknat antal ejdrar Somateria mollissima på västkusten<br />
vid de fyra tillfällen områdena flyginventerats (kompletterat<br />
med l<strong>and</strong>baserade räkningar).<br />
1971–74 1987–89 2004 2009<br />
Bohuslän 2900 5500 36600 40700<br />
Hall<strong>and</strong> 1200 2300 9300 5300<br />
NV Skåne 4500 1900 2400 6000<br />
Total 8600 9700 48300 52000<br />
Red-breasted Merganser Mergus serrator<br />
The Red-breasted Merganser is well spread around<br />
the coasts <strong>of</strong> south Sweden occurring both in inshore<br />
<strong>and</strong> <strong>of</strong>fshore waters (figure 17). Numbers<br />
counted in the annual midwinter counts is large<br />
enough to allow the calculation <strong>of</strong> annual indices.<br />
In the 2009 survey the largest <strong>numbers</strong> counted in<br />
the Swedish part <strong>of</strong> the Baltic were found around<br />
the falsterbo peninsula, in southern Kalmarsund<br />
<strong>and</strong> around Gotl<strong>and</strong>. Only small <strong>numbers</strong> were<br />
found in the archipelagos as was also the case for<br />
the aerial surveys in the archipelagos <strong>and</strong> inshore<br />
Table 6. Estimated totals <strong>of</strong> Eiders Somateria mollissima in different areas along the Swedish Baltic coast in the<br />
winters 2007–2011. <strong>Distribution</strong> map for 2009 in figure 15. A dash indicates absence <strong>of</strong> count.<br />
Skattat antal ejdrar Somateria mollissima inom olika områden efter den svenska Östersjökusten 2007–2011.<br />
Utbredningskarta för 2009 i Figur 15. Ett streck anger avsaknad av räkning.<br />
Area 2007 2009 2010 2011<br />
falsterbo 10500 12700 11660 9915<br />
Skåne south coast 300 90 – 348<br />
Skåne southeast – – – –<br />
Hanöbukten 1100 230 – 13<br />
Blekinge archipelago – – – 0<br />
Kalmarsund 1500 780 363 0<br />
Öl<strong>and</strong> east coast 3800 420 – 113<br />
Öl<strong>and</strong> North banks 0 0 0 740<br />
Midsjöbankarna – 9 0 0<br />
Hoburg Bank – 90 0 40<br />
Gotl<strong>and</strong> east coast – 5400 675 6700<br />
Gotl<strong>and</strong> north – – – 0<br />
Gotl<strong>and</strong> west – – – –<br />
Kalmar archipelago – – – ICE<br />
Östergötl<strong>and</strong> archipelago – – – ICE<br />
Södermanl<strong>and</strong> archipelago – – – ICE<br />
Stockholm archipelago – – – ICE<br />
Uppl<strong>and</strong> coast – – – ICE<br />
Gävlebukten – – – ICE<br />
Total 19719 12698 17869
figure 16. The distribution <strong>of</strong> Eider Somateria mollissima<br />
along the Swedish west coast during the winter 2009.<br />
Ejderns Somateria mollissima utbredning efter den svenska<br />
västkusten vintern 2009<br />
figure 17. The distribution <strong>of</strong> Red-breasted Merganser Mergus<br />
serrator in Swedish waters in the mild winter 2009.<br />
Utbredningen för småskrake Mergus serrator i svenska farvatten<br />
den milda vintern 2009.<br />
areas in the early seventies <strong>and</strong> in 2004 (Nilsson<br />
1975, 2008).<br />
Based on the aerial surveys <strong>of</strong> the transects in<br />
the Baltic, adding grounds counts from the shore<br />
from areas not covered from the air gives an estimate<br />
<strong>of</strong> about 8000 Red-breasted Mergansers<br />
(Table 8). There is however a marked variation in<br />
the <strong>numbers</strong> <strong>of</strong> the species in the <strong>of</strong>fshore Swedish<br />
waters. Thus the estimate for the waters around<br />
falsterbo <strong>and</strong> the southern part <strong>of</strong> the Öresund was<br />
about 2000 for 2009, but censuses in connection<br />
with the lillgrund <strong>of</strong>fshore wind farm have given<br />
estimates <strong>of</strong> up to 12 000 Red-breasted Mergansers<br />
in this area (Nilsson & Green 2011). The surveys<br />
on the west coast in 2009 were aimed at covering<br />
Eiders (<strong>and</strong> Scoters in southern Kattegat) <strong>and</strong> do<br />
not allow an estimate <strong>of</strong> the <strong>wintering</strong> <strong>numbers</strong><br />
<strong>of</strong> Red-breasted Mergansers here. In the Öresund<br />
about 900 were counted <strong>and</strong> close to 2000 were<br />
found on the west coast north <strong>of</strong> Öresund here at<br />
the country-wide surveys in 2004 (Nilsson 2008),<br />
so it is probable that the <strong>wintering</strong> population in<br />
Swedish waters in 2009 could be in the order <strong>of</strong> at<br />
least 11 000 individuals. There is however a very<br />
marked variation between years as seen from the<br />
lillgrund studies mentioned above.<br />
There are unfortunately no comparable data to<br />
elucidate any changes in the overall population <strong>of</strong><br />
the species in <strong>of</strong>fshore Swedish waters. The Swedish<br />
Midwinter counts show a significant increasing<br />
trend since the start <strong>of</strong> the counts (Nilsson 2008),<br />
although <strong>numbers</strong> were low<br />
53
Table 8. Estimated totals <strong>of</strong> Red-breasted Mergansers Mergus serrator in different areas along the Swedish Baltic<br />
coast in the winters 2007–2011. <strong>Distribution</strong> map for 2009 in figure 17. A dash indicates absence <strong>of</strong> count.<br />
Skattat antal småskrakar Mergus serrator inom olika områden efter den svenska Östersjökusten 2007–2011.<br />
Utbredningskarta för 2009 i Figur 17. Ett streck anger avsaknad av räkning.<br />
Area 2007 2009 2010 2011<br />
falsterbo 2600 2000 4510 2610<br />
Skåne south coast 200 300 – 760<br />
Skåne southeast – – – 0<br />
Hanöbukten 200 700 – 110<br />
Blekinge archipelago 0 670 – 0<br />
Kalmarsund 900 1200 60 638<br />
Öl<strong>and</strong> east coast 300 500 – 1575<br />
Öl<strong>and</strong> North banks 0 0 0 102<br />
Midsjöbankarna – 0 60 0<br />
Hoburg Bank – 0 0 238<br />
Gotl<strong>and</strong> east coast – 1700 – 163<br />
Gotl<strong>and</strong> north – – – 0<br />
Gotl<strong>and</strong> west – 825 – –<br />
Kalmar archipelago – 0 – ICE<br />
Östergötl<strong>and</strong> archipelago – 0 – ICE<br />
Södermanl<strong>and</strong> archipelago – 0 – ICE<br />
Stockholm archipelago – 0 – ICE<br />
Uppl<strong>and</strong> coast – 0 – ICE<br />
Gävlebukten – 0 – ICE<br />
Total 7840<br />
Discussion<br />
from the data presented here <strong>and</strong> in comparison<br />
with the estimates from the total surveys <strong>of</strong> <strong>wintering</strong><br />
<strong>sea</strong>birds in the Baltic (Durinck et al. 1994,<br />
Skov et al. 2011; see also Delany & Scott 2006 for<br />
the entire NW Europe) it is clear that the Swedish<br />
<strong>of</strong>fshore areas in the Baltic are <strong>of</strong> very large<br />
international importance for <strong>wintering</strong> <strong>sea</strong><strong>ducks</strong>,<br />
especially for the long-tailed Duck but also for the<br />
Red-breasted Merganser (Nilsson 2008) whereas<br />
the two scoter species are more sparse.<br />
When comparing the estimates for Swedish waters<br />
presented here with the population estimates<br />
for NW Europe presented by Delany & Scott<br />
(2006) <strong>and</strong> with the two All Baltic surveys (Durinck<br />
et al. 1994, Skov et al. 2011) it is important<br />
to bear in mind the differences in methods used<br />
during the two all Baltic surveys with the different<br />
uncertainties <strong>and</strong> biases attached to the two<br />
methods (see above). These factors will also have<br />
a great importance when evaluating the population<br />
changes indicated in the report from the SOWBAS<br />
study (Skov et al. 2011).<br />
The results <strong>of</strong> the two all-Baltic surveys indicate<br />
a very marked decrease in the population <strong>of</strong> longtailed<br />
Duck between the two surveys, from 4.3 to<br />
1.5 million (Skov et al 2011). The Swedish winter-<br />
54<br />
ing population was 32% <strong>and</strong> 29% <strong>of</strong> the published<br />
estimates for the entire Baltic in the two surveys,<br />
showing that the decline was similar in Swedish<br />
waters as elsewhere. The decrease in the population<br />
within Swedish waters was mainly concentrated<br />
to Hoburgbank <strong>and</strong> the <strong>of</strong>fshore waters <strong>of</strong><br />
east Gotl<strong>and</strong>, whereas there was no such decrease<br />
for the Midsjö banks <strong>and</strong> with stable <strong>wintering</strong><br />
<strong>numbers</strong> or only smaller decreases (within the calculation<br />
error) established for the <strong>wintering</strong> areas<br />
around Öl<strong>and</strong> <strong>and</strong> along the mainl<strong>and</strong> coast.<br />
In spring, the long-tailed Ducks migrate to the<br />
breeding areas in northern Russia, a major part <strong>of</strong><br />
the population passing the Gulf <strong>of</strong> finl<strong>and</strong>. During<br />
this migration the <strong>numbers</strong> have been counted from<br />
sites in finl<strong>and</strong> <strong>and</strong> Estonia (Bergman 1974, Hario<br />
et al. 2009). Counts at Söderskär on the finnish<br />
coast showed an increase from about 1970 to the<br />
early 1990s, followed by a marked decrease (Hario<br />
et al. 2009, see also Kauppinen & leivo 2008).<br />
The highest counts <strong>of</strong> spring migrants coincided<br />
with the first all Baltic survey (1992/1993), which<br />
yielded much higher estimates than the 2007–2009<br />
survey. Unfortunately there are no available data<br />
to show whether there has been a similar increase<br />
in the <strong>numbers</strong> <strong>of</strong> <strong>wintering</strong> long-tailed Ducks in<br />
the Baltic as indicated from the finnish migration
counts. The only winter censuses from the seventies<br />
are the ones presented here which do not cover<br />
the important <strong>of</strong>fshore banks, which are used by<br />
the majority <strong>of</strong> long-tailed Ducks in Swedish waters.<br />
Different factors have been discussed in relation<br />
to the marked decline <strong>of</strong> the long-tailed Ducks<br />
during recent years such as oil pollution, bycatches<br />
in fishing equipment <strong>and</strong> decreased habitat quality<br />
(larsson & Tydén 2005, Stempniewicz 1994, Skov<br />
et al. 2011, Zydelis et al. 2009) but also factors on<br />
the breeding areas on the Russian tundra( Hario<br />
et al.2009). Probably the decline <strong>of</strong> the <strong>wintering</strong><br />
long-tailed Duck population is caused by a combination<br />
<strong>of</strong> different factors. The availability <strong>and</strong><br />
quality <strong>of</strong> the food is probably an important factor<br />
here as there have been marked decreases among<br />
several mussel eaters in the Baltic. The steady impact<br />
<strong>of</strong> small discharges <strong>of</strong> oil has certainly had<br />
an important impact on the <strong>wintering</strong> long-tailed<br />
Ducks (larsson & Tydén 2005). The most marked<br />
decline in the Swedish waters was found for the<br />
Hoburg bank <strong>and</strong> the east coast <strong>of</strong> Gotl<strong>and</strong>, these<br />
waters being on the main shipping line to the Bay<br />
<strong>of</strong> finl<strong>and</strong> <strong>and</strong> St Petersburg. There are also indications<br />
on a low rate <strong>of</strong> young production that can<br />
either be related to factors on the breeding grounds<br />
in Russia or to a decline in the quality <strong>of</strong> the food<br />
for the females building up the condition before the<br />
migration to the breeding areas.<br />
The idea has also been put forward that the decline<br />
in the Baltic Sea reflects a change in the winter<br />
distribution <strong>of</strong> the species, but there are no data<br />
supporting this idea. Within the Baltic all potential<br />
winter areas were surveyed during the SOWBAS<br />
study.<br />
Similar to the long-tailed Duck, the Common<br />
Scoter <strong>and</strong> the Velvet Scoter both have large <strong>wintering</strong><br />
populations in the Baltic Sea <strong>and</strong> both have<br />
decreased markedly (Skov et al. 2011). These<br />
species have only small <strong>wintering</strong> populations in<br />
Swedish waters. The same applies to the winter<br />
population <strong>of</strong> Eiders in the Swedish part <strong>of</strong> the<br />
Baltic. The large <strong>numbers</strong> <strong>of</strong> breeding Eiders from<br />
the Swedish Baltic coast leave the country for the<br />
winter <strong>and</strong> are mainly found in the southwestern<br />
part <strong>of</strong> the Baltic <strong>and</strong> the Kattegat (Desholm et al.<br />
2002, Ekroos et al. 2012).<br />
The Swedish breeding population <strong>of</strong> the Eider<br />
showed a marked increase from the first larger<br />
studies in the seventies to the nineties, followed by<br />
a very marked decrease back to the level recorded<br />
in the seventies (Ekroos et al. 2012). Marked decreases<br />
have also been found in the <strong>wintering</strong> pop-<br />
ulation <strong>of</strong> the whole northwestern Europe. In contrast<br />
to this there has been no decrease in the size<br />
<strong>of</strong> the <strong>wintering</strong> <strong>numbers</strong> <strong>of</strong> Eiders on the Swedish<br />
west coast. One cannot avoid drawing attention<br />
to the fact that that there is a parallel between the<br />
numerical patterns <strong>of</strong> <strong>wintering</strong> long-tailed Ducks<br />
<strong>and</strong> breeding Eiders. In both species there was a<br />
long term increase to a peak followed by a decline,<br />
similar patterns even if they did not peak at exactly<br />
the same time. In the Eider, change in food availability<br />
(mussels) has been advanced as an explanation,<br />
<strong>and</strong> I consider it likely that the same factor<br />
may have played a role for the long-tailed Duck.<br />
The four <strong>sea</strong>duck species discussed above all<br />
show marked decreases between the two large<br />
surveys. All four species are benthic feeders to a<br />
large extent relying on mussels. The fifth species<br />
common in the Swedish <strong>of</strong>fshore waters, the Redbreasted<br />
Merganser, is a fish-eater. According to<br />
the SOWBAS study (Skov et al. 2011) there are<br />
indications <strong>of</strong> a decrease also for this species, but<br />
the data from Swedish waters indicate an increasing<br />
trend. In contrast to the <strong>of</strong>fshore species discussed<br />
here, counts <strong>of</strong> inshore <strong>sea</strong><strong>ducks</strong> (<strong>and</strong> other<br />
diving <strong>ducks</strong>) mainly show increasing trends (Nilsson<br />
2008).<br />
Acknowledgements<br />
The <strong>of</strong>fshore aerial surveys reported here as well<br />
as the Swedish Midwinter Counts are supported by<br />
grants from Naturvårdsverket (the Swedish Environmental<br />
Protection Agency). The same applies<br />
to the aerial surveys in the seventies which were<br />
also supported by the Swedish Airforce, which provided<br />
free flying time. I am also grateful for the<br />
support <strong>of</strong> the Swedish Coast Guard that allowed<br />
duck counters onboard their patrol ships during the<br />
surveys in the sixties <strong>and</strong> seventies.<br />
The aerial surveys could not have been done<br />
without the help <strong>of</strong> a number <strong>of</strong> skilled observers<br />
<strong>and</strong> I will give my sincere thanks to David Erterius,<br />
Martin Granbom, Martin Green, Nils Kjellen, Johan<br />
Nilsson, Roine Str<strong>and</strong>berg <strong>and</strong> Mikael Svensson<br />
for many observer hours over the open <strong>sea</strong>.<br />
Martin Green kindly commented on an earlier version<br />
<strong>of</strong> the manuscript.<br />
Permission to publish the maps in the figures<br />
granted by Sjöfartsverket© 12-01905.<br />
References<br />
Bergman, G. 1974. The spring migration <strong>of</strong> the long-tailed<br />
Duck <strong>and</strong> the Common Scooter in western finl<strong>and</strong>. Ornis<br />
55
Fennica 51: 129–145.<br />
Delany, S. & Scott, D., eds. 2006. Waterbird Population Estimates<br />
– Fourth Edition. Wetl<strong>and</strong>s International, Wageningen,<br />
The Netherl<strong>and</strong>s.<br />
Dersholm, M., Christensen, T.K., Hario, M., Andersson, Å.,<br />
Ens, B., Camphuysen, C.J., Nilsson, l., Waltho, C.M.,<br />
lorentsen, S-H., Kuresoo, A., Kats, R.K.H., fleet,D.M.<br />
& fox, A.D. 2002. Status <strong>of</strong> the Baltic/Wadden Sea population<br />
<strong>of</strong> the Common Eider Somateria m. mollissima.<br />
Wildfowl 53: 167–203.<br />
Durinck, J., Skov,H., Jensen, f.P. & Pihl, S. 1994. Important<br />
Marine Areas for Wintering Birds in the Baltic Sea. Ornis<br />
Consult, Copenhagen, Denmark.<br />
Ekroos, J., fox, A.D., Christensen, T.K., Petersen, I.K., Kilpi,<br />
M., Jonsson, J.E., Green, M., laursen, K., Cervencl,<br />
A., de Boer, P., Nilsson, l., Meissner, W., Garthe, S. &<br />
Öst, M. 2012. Declines amongst breeding Eider Somateria<br />
mollissima <strong>numbers</strong> in the Baltic/Wadden Sea flyway.<br />
Ornis Fennica 89: in print.<br />
Haapanen, A. & Nilsson, l. 1979. Breeding waterfowl populations<br />
in northern fennosc<strong>and</strong>ia. Ornis Sc<strong>and</strong>inavica<br />
10: 145–219.<br />
Hario, M., Rintala, J. & Nordenswan, G. 2009. (Dynamics <strong>of</strong><br />
<strong>wintering</strong> long-tailed <strong>ducks</strong> in the Baltic Sea – the connection<br />
with lemming cycles, oil disasters <strong>and</strong> hunting). Suomen<br />
Riista 55: 83–96 (finnish with English summary).<br />
Kauppinen, T.J. & leivo, K.M. 2008. Vaimeneeko allin laulu?<br />
Suomen Luonto 2: 20–25. (In finnish)<br />
larsson, K. & Tydén, l. 2005. Effekter av oljeutsläpp på<br />
övervintr<strong>and</strong>e alfågel Clangula hyemalis vid Hoburgs<br />
bank i central Östersjön mellan 1996/97 och 2003/04. Ornis<br />
Svecica 15: 161–171.<br />
Joensen, A.H. 1974. Wildfowl populations in Denmark<br />
1965–1973. A survey <strong>of</strong> non-breeding populations <strong>of</strong><br />
Ducks, Swans <strong>and</strong> Coot <strong>and</strong> their shooting utilization.<br />
Danish Review <strong>of</strong> Game Biology 9(1): 1–206.<br />
Mathiasson, S. 1970. Numbers <strong>and</strong> distribution <strong>of</strong> longtailed<br />
Ducks <strong>wintering</strong> in northern Europe. British Birds<br />
63: 414–424.<br />
Nilsson, l. 1972. Habitat Selection, food Choice <strong>and</strong> feeding<br />
Habits <strong>of</strong> Diving Ducks in Coastal Waters <strong>of</strong> South<br />
Sweden during the Non-breeding Season. Ornis Sc<strong>and</strong>inavica<br />
3: 55–78.<br />
Nilsson, l. 1975. Midwinter distribution <strong>and</strong> <strong>numbers</strong> <strong>of</strong><br />
Swedish Anatidae. Ornis Sc<strong>and</strong>inavica 7:193–205.<br />
Nilsson, l. 1977. November distribution <strong>and</strong> <strong>numbers</strong> <strong>of</strong><br />
Swedish Anatidae. Viltrevy 10: 41–77.<br />
Nilsson, l. 1980. De övervintr<strong>and</strong>e alfåglarnas Clangula hyemalis<br />
antal och utbredning längs den svenska kusten. Vår<br />
Fågelvärld 39: 1–14.<br />
Nilsson, l. 2008. Changes in <strong>numbers</strong> <strong>and</strong> distribution <strong>of</strong><br />
<strong>wintering</strong> waterfowl in Sweden during forty years, 1967–<br />
2006. Ornis Svecica 18: 135–226.<br />
Nilsson, l. & Green, M. 2011. Birds in the southern Öresund<br />
in relation to the windfarm at Lillgrund. Final report <strong>of</strong><br />
the monitoring program 2001–2011. Report from Biologiska<br />
Institutionen, lunds Universitet.<br />
Skov, H., Heinänen, S., Zydelis, R., Bellebaum, J., Bzoma,<br />
S., Dagys, M., Durinck, J., Garthe, S., Grishanov, G., Hario,<br />
M., Kieckbusch, J.J., Kube, J., Kuresoo, A., larsson,<br />
K., luigujoe, l., Meissnerm, W., Nehls, H.W., Nilsson,<br />
l., Petersen, I.K., Roos, M., Pihl, S., Sonntag, N., Stock,<br />
A. & Stipniece, A. 2011. Waterbird Population <strong>and</strong> Pres-<br />
56<br />
sures in the Baltic Sea. Tema Nord 2011: 550.<br />
Stempniewicz, l. 1994. Marine birds drowning in fish nets<br />
in the Gulf <strong>of</strong> Gdansk (southern Baltic): <strong>numbers</strong>, species<br />
composition, age <strong>and</strong> sex structure. Ornis Svecica 4:<br />
123–132.<br />
Zydelis, R., Bellebaum, J., Österblom, H., Vetemaa, M.,<br />
Schirmeister, B., Stipniece, A., Dagys, M., van Eerden,<br />
M. & Garthe, S. 2009. Bycatch in gillnet fisheries – An<br />
overlooked threat to waterbird populations. Biological<br />
Conservation 142: 1269–1281.<br />
Sammanfattning<br />
Årliga midvinterinventeringar av övervintr<strong>and</strong>e<br />
sjöfåglar har organiserats i Sverige sedan 1967 som<br />
en del av de Internationella Midvinterinventeringarna<br />
samordnade av Wetl<strong>and</strong>s International (Nilsson<br />
2008). Dessa inventeringar utgör nu en del<br />
av det nationella miljöövervakningsprogrammet.<br />
Under de första åren försökte man täcka så stora<br />
områden som möjligt (Nilsson 1975), men senare<br />
koncentrerades inventeringarna till att täcka ett<br />
representativt urval lokaler för att ge underlag för<br />
beräkning av årliga index för de viktigaste arterna.<br />
Under åren 1965–1978 genomfördes ett betyd<strong>and</strong>e<br />
antal båtinventeringar utanför de svenska<br />
kusterna från kustbevakningens patruller, varvid<br />
betyd<strong>and</strong>e områden i skärgårdarna och utanför de<br />
öppna kusterna kunde täckas (Nilsson 1972, 1980).<br />
Omfatt<strong>and</strong>e flyginventeringar genomfördes också<br />
i skärgårdarna och längs de öppna kusterna under<br />
dessa år (Nilsson 1975). Vissa <strong>of</strong>fshore områden<br />
kunde också täckas med flyg.<br />
De tidiga undersökningarna under 1960- och<br />
1970-talen gav en hel del information om de havslev<strong>and</strong>e<br />
dykändernas förekomst i svenska farvatten,<br />
något som tidigare varit ganska dåligt känt<br />
(jfr dock Mathiasson 1970). Under dessa år var det<br />
emellertid inte möjligt att täcka in utsjöbankar som<br />
Midsjöbankarna och Hoburgs Bank, som redan då<br />
var kända som viktiga lokaler för speciellt alfågel.<br />
Efter de politiska förändringarna i området genomfördes<br />
en första samordnad inventering med båt<br />
och flyg i hela Östersjön 1992 och 1993 (Durinck<br />
et al. 1994). Denna inventering upprepades under<br />
åren 2007–2009 i SOWBAS-projektet (Skov<br />
et al. 2011). Parallellt med dessa undersökningar<br />
genomfördes under 2009–2011 på Naturvårdsverkets<br />
uppdrag inventeringar i de svenska farvattnen<br />
med flyg för att kartlägga sjöfågelförekomsten och<br />
för att utarbeta ett förslag på hur dessa fåglar skall<br />
kunna följas upp inom övervakningsprogrammen.<br />
I denna uppsats sammanfattas resultaten från<br />
inventeringarna i de svenska farvattnen under<br />
2007–2011 och jämförs med de inventeringar som
genomförts i de inre farvattnen och vissa utsjöområden<br />
under den tidiga inventeringsperioden samt<br />
med resultaten från den första sammanfatt<strong>and</strong>e<br />
inventeringen av Östersjön (Durnick et al. 1994,<br />
Nilsson 1975, 1980). Jag koncentrerar mig här på<br />
de arter som täcks dåligt av de traditionella midvinterinventeringarna,<br />
dvs. alfågel, svärta, sjöorre,<br />
ejder och småskrake. De båda sistnämnda ses i tillräcklig<br />
omfattning vid de årliga midvinterinventeringarna<br />
för att ge underlag för indexberäkningar<br />
(Nilsson 2008), men de förekommer också i utsjöområdena<br />
och beh<strong>and</strong>las därför också i detta sammanhang.<br />
Material och metodik<br />
Vid inventeringarna 2007–2011 täcktes de yttre<br />
havsområdena med linjetaxeringar från flygplan.<br />
Inventeringslinjerna lades ut så att de täckte alla<br />
viktigare havsområden (inkl. utsjöbankar) i de<br />
svenska havsområdena. Gränsen mot djupare vatten<br />
lades vid ett djup på 30 m. Ett exempel på utlägg<br />
av inventeringslinjer visas från Hanöbukten<br />
(figur 1). Här låg linjerna med 2 km mellanrum,<br />
men i de flesta havsområden låg de med 4 km mellanrum.<br />
I ostkustskärgårdarna startade linjerna i<br />
princip i zonen med större öar och gick ut till djupt<br />
vatten.<br />
Vid flyginventeringarna använde vi en CESSNA<br />
337 Skymaster, en tvåmotorig högvingad maskin,<br />
godkänd för utsjöflygningar, och med god sikt.<br />
Normalt flög vi på ca 70 m höjd med en hastighet<br />
av ca 150–180 km/h. Navigeringen skedde mellan<br />
förutbestämda punkter med planets GPS. Vid observationerna<br />
medverkade minst två observatörer,<br />
en bredvid piloten och en bakom, vilka täckte var<br />
sin sida av planet. Ibl<strong>and</strong> medföljde en tredje observatör.<br />
Alla iakttagelser talades in på b<strong>and</strong> med<br />
tidsangivelse. Den exakta flygvägen loggades på<br />
en separat GPS. Observationerna lades sedan in i<br />
en databas med exakta positioner för varje observation.<br />
Vid inventeringarna räknade vi samtliga observerade<br />
fåglar. Inventeringarna koncentrerades till<br />
ett b<strong>and</strong> på 200 m på vardera sidan av flygplanet.<br />
fåglar utanför denna zon noterades som extra information<br />
och markerades speciellt i databasen.<br />
Observatörerna hade en död zon på vardera sidan<br />
av planet, som beräknas till ca 40 m på vardera sidan.<br />
Detta innebär i praktiken att den inventerade<br />
zonen blir 320 m bred. Vid analyserna har sedan<br />
inventeringsdata från denna 400 m breda zon omräknats<br />
till antal individer per större områden baserat<br />
på räkningarna i inventeringsbältet och uppräk-<br />
ningsfaktor (6,25 resp. 12,5 för inventeringslinjer<br />
med 2 resp. 4 km lucka) baserad på täckningsgraden<br />
inom relevanta djupområden.<br />
Under 2007 kunde endast begränsade inventeringar<br />
genomföras i sydligaste Sverige, medan mer<br />
omfatt<strong>and</strong>e inventeringar gjordes under 2009–2011<br />
(figur 2). Vädermässigt skilde sig vintrarna åt markant.<br />
2009 (liksom 2007) var en mild vinter med<br />
endast ringa isläggning, medan 2010 och 2011 var<br />
hårda isvintrar i Östersjön. Bl<strong>and</strong> annat var Kalmarsund<br />
och skärgårdarna norr därom täckta med<br />
is liksom stora delar av östra Östersjön (jfr. figur<br />
5).<br />
Resultaten från inventeringarna 2007–2011<br />
jämförs nedan med de båda större Östersjöinventeringarna<br />
1992/93 och 2007–2009 (Durinck et al.<br />
1994, Skov et al. 2011). Vid jämförelserna måste<br />
man beakta att den svenska inventeringen 2007–<br />
2011 grundas på täta linjetaxeringar med flyg,<br />
medan många av de svenska områdena 1992/93<br />
endast kunde täckas med ett fåtal inventeringslinjer<br />
från båt. Skattningarna grundas i betyd<strong>and</strong>e<br />
utsträckning på modellering, vilket innebär att det<br />
föreligger en betyd<strong>and</strong>e osäkerhet i många värden.<br />
Vid den senare inventeringen användes också modellering<br />
för totalskattningarna av Östersjön, men<br />
underlaget från de svenska vattnen var betydligt<br />
bättre. De i denna uppsats redovisade skattningarna<br />
baseras direkt på inventeringarna och de nämnda<br />
uppräkningsfaktorerna.<br />
Resultat<br />
Alfågel<br />
Alfåglarna efter den svenska kusten är starkt begränsade<br />
till Östersjön med endast enstaka på västkusten<br />
(figur 3). Merparten av alfåglarna vintern<br />
2009 observerades på de tre utsjöbankarna: Hoburgs<br />
bank och de båda Midsjöbankarna. Totalt<br />
sågs här ca 300 000 av totalt beräknade 436 000<br />
för hela det svenska området (figur 3, 4, Tabell 1).<br />
Betyd<strong>and</strong>e antal återfanns också runt Öl<strong>and</strong>s och<br />
Gotl<strong>and</strong>s kuster, Hanöbukten, Kalmarsund samt<br />
ytterskärgårdarna från Kalmarsund till Stockholms<br />
skärgård.<br />
De båda vintrarna 2010 <strong>and</strong> 2011 med hårda isförhåll<strong>and</strong>en<br />
medförde en helt annan utbredning<br />
för alfåglarna i de svenska farvattnen. Totalt beräknades<br />
antalet alfåglar på de tre viktigaste utsjöbankarna<br />
till 630 000 2010 och 365 000 2011. Vintern<br />
2010 beräknades inte mindre än 426 000 alfåglar<br />
för Hoburgs bank. En viktig orsak till dessa höga<br />
antal på de svenska utsjöbankarna är isläget i Östersjön.<br />
De viktiga alfågelområdena i Irbesundet<br />
57
och Rigabukten var helt istäckta och man kan anta<br />
att många av dessa alfåglar sökte sig till de svenska<br />
farvattnen.<br />
Vid den tidigare totalinventeringen av Östersjön<br />
beräknades beståndet för de svenska farvattnen till<br />
1,4 miljoner att jämföras med 0,44 miljoner 2009,<br />
en mycket markant nedgång, men den exakta storleken<br />
på nedgången är svårbedömt då skattningarna<br />
1992/93 och 2007–2009 grundas på olika metoder.<br />
från flera viktiga områden föreligger data också<br />
från 1970-talet (Tabell 1, se också Nilsson 1980).<br />
för Hanöbukten och skärgårdsområdena föreligger<br />
det inga klara skillnader mellan 1970-talets inventeringar<br />
och de sentida inventeringarna, medan<br />
inventeringarna norr och öster om Öl<strong>and</strong> antyder<br />
en nedgång av beståndet. Tyvärr saknas mer omfatt<strong>and</strong>e<br />
data från Gotl<strong>and</strong>. Vid en flyginventering<br />
1974 räknades 26 000 alfåglar efter inventeringslinjen,<br />
vilket med erfarenheter från de senare inventeringarna<br />
kan antas motsvara ett övervintr<strong>and</strong>e<br />
bestånd på 200 000–400 000. Inom vissa områden<br />
täcks alfåglarna väl av de årliga midvinterinventeringarna<br />
från l<strong>and</strong> (figur 5). för den skånska sydkusten<br />
och Blekinges skärgård noteras signifikanta<br />
nedåtgående trender, medan det inte finns några<br />
klara trender för antalet alfåglar vid norra Öl<strong>and</strong><br />
samt vid Väddö i Uppl<strong>and</strong>.<br />
Alfåglarnas utbredning inom olika avsnitt av den<br />
svenska kusten exemplifieras i en serie regionala<br />
kartor från de viktigaste alfågelområdena efter den<br />
svenska kusten (figur 6–11). Detaljutbredningen<br />
på de viktiga utsjöbankarna Midsjöbankarna och<br />
Hoburgsbanken diskuteras inte närmare här, då alfåglarnas<br />
uppträd<strong>and</strong>e här är föremål för speciella<br />
undersökningar och kommer att beh<strong>and</strong>las i ett annat<br />
sammanhang.<br />
I Hanöbukten och utanför Öl<strong>and</strong>s ostkust är alfåglarna<br />
fördelade ut till ett djup av ca 30 m. för<br />
Hanöbukten visade inventeringarna på betyd<strong>and</strong>e<br />
skillnader mellan olika år. Vid något tillfälle förekom<br />
alfåglarna väl spridda, medan de under<br />
<strong>and</strong>ra inventeringar var tämligen koncentrerade<br />
till vissa bankar, t.ex. Kiviksbredan, som vid båtinventeringar<br />
på 1960-talet konstaterades vara en<br />
viktig lokal. Vid Öl<strong>and</strong> noterades koncentrationer<br />
vid södra Öl<strong>and</strong> samt runt norra Öl<strong>and</strong>s bankar. I<br />
skärgårdarna från Kalmarsund och norrut förekom<br />
de flesta alfågelflockar vid havsgrund främst i den<br />
yttre skärgådszonen.<br />
Svärta<br />
Svärtan förekommer i relativt låga antal efter den<br />
svenska kusten under vintern (Tabell 3, 4). Vid inventeringen<br />
2009 förekom den i någorlunda antal<br />
58<br />
bara i södra Kattegatt där ca 2500 individ noterades,<br />
medan antalet svärtor i Östersjön var betydligt<br />
lägre (figur 13).<br />
Sjöorre<br />
Sjöorren är en regelbunden vintergäst i den södra<br />
delen av den svenska Östersjökusten samt i laholmsbukten<br />
och Skälderviken i södra Kattegatt<br />
(Tabell 4, 5). Vid inventeringen i delar av undersökningsområdet<br />
vintern 2007 beräknades antalet<br />
sjöorrar till ca 40 000 i Hanöbukten, södra Kalmarsund<br />
och runt Öl<strong>and</strong> (Tabell 5), men betydligt<br />
lägre antal fanns här de <strong>and</strong>ra undersökningsåren.<br />
Beståndet i södra Kattegatt beräknades 2009 till 13<br />
500. Sjöorrens utbredning vintern 2009 visas i figur<br />
13 och detaljutbredningen i Hanöbukten under<br />
två vintrar i figur 14.<br />
Ejder<br />
I Sverige återfinns merparten av de övervintr<strong>and</strong>e<br />
ejdrarna på Västkusten, medan Östersjöns häck<strong>and</strong>e<br />
ejdrar i huvudsak lämnar den svenska delen av<br />
Östersjön under vintern (figur 15, Tabell 6, 7). Vid<br />
inventeringarna 2009 beräknades beståndet på den<br />
svenska västkusten till ca 52 000, medan det fanns<br />
ca 20 000 övervintr<strong>and</strong>e ejdrar i den svenska delen<br />
av Östersjön. längs västkusten förekom ejdern<br />
spridd från norra Öresund till den norska gränsen<br />
med den största delen i Bohuslän (figur 16). I Kattegatt<br />
fanns de i huvudsak i de ganska str<strong>and</strong>nära<br />
områdena, medan merparten av Bohusläns ejdrar<br />
fanns i ytterskärgården, huvudsakligen på öarnas<br />
västsidor där de rikaste musselbankarna finns. Det<br />
övervintr<strong>and</strong>e ejderbeståndet på västkusten har inventerats<br />
vid fyra tillfällen (Tabell 7). från 1987/89<br />
till 2004 ökade antalet övervintrare från mindre än<br />
10 000 till 48 300, medan endast en mindre ökning<br />
skedde därefter till 52 000 2009.<br />
Småskrake<br />
Småskraken var 2009 väl spridd efter kusterna i<br />
södra Sverige både i de inre farvattnen och i utsjövattnen,<br />
men förekomsten i skärgårdarna liksom på<br />
västkusten var ganska sparsam (figur 17, Tabell 8).<br />
flertalet småskrakar fanns efter kusterna av Skåne,<br />
södra Kalmarsundsregionen samt Gotl<strong>and</strong>. Totalt<br />
beräknades beståndet till ca 9000 individer, varav<br />
8000 på ostkusten (Tabell 8) och ca 1000 i Öresund<br />
och västkusten.<br />
Diskussion<br />
De här presenterade inventeringarna i relation till<br />
de båda Östersjöinventeringarna (Durinck et al.
1994, Skov et al. 2011), där de svenska inventeringarna<br />
ingår, visar klart att de svenska farvattnen<br />
i Östersjön är av stor betydelse internationellt för<br />
det övervintr<strong>and</strong>e beståndet av alfågel.<br />
Vid den första inventeringen (Durinck et al.<br />
1994) beräknades totalbeståndet av alfågel i Östersjöområdet<br />
till 4,3 miljoner, varav 1,4 miljoner<br />
fanns i de svenska farvattnen, främst på Hoburgs<br />
Bank och områdena öster om Gotl<strong>and</strong>. Inventeringen<br />
2007–2009 (Skov et al. 2011) gav 1,5 miljoner<br />
för hela Östersjön, medan beståndet i de svenska<br />
farvattnen här skattas till 0,43 miljoner. Betydligt<br />
högre antal noterades i de svenska vattnen under<br />
isvintern 2010, då områdena vid Rigabukten var<br />
helt frusna.<br />
Även om skillnaderna i inventeringsmetodik<br />
mellan de båda storinventeringarna gör dem svåra<br />
att jämföra står det klart att alfågelbeståndet minskat<br />
markant sedan 1990-talet. I de svenska farvattnen<br />
är detta mest markant för Hoburgs Bank och<br />
farvattnen runt Gotl<strong>and</strong> och förmodligen till en<br />
del vid Öl<strong>and</strong>, medan fastl<strong>and</strong>ets skärgårdar visar<br />
ungefär samma alfågelbestånd som på 1970-talet.<br />
En signifikant minsk<strong>and</strong>e trend har dock noterats<br />
längs kusterna av Blekinge och södra Skåne.<br />
Flera faktorer har framförts som möjliga orsaker<br />
till alfåglarnas markanta beståndsnedgång<br />
såsom oljeföroreningar, bifångster vid fiske, men<br />
också att förhåll<strong>and</strong>ena på häckningsområdena<br />
ändrats (Hario et al. 2009, Larsson & Tydén 2005,<br />
Stempniewicz 1994, Skov et al. 2011, Zydelis et al.<br />
2009). Det minsk<strong>and</strong>e antalet alfåglar i Östersjön<br />
sedan 1990-talet återspeglas också i sträckräkningar<br />
från den finska kusten (Hario et al. 2009, se also<br />
Kauppinen & Leivo 2008), vilka också antyder en<br />
ökning av antalet från 1970- talet till 1990-talet<br />
före den markanta nedgången.<br />
Även för svärtan och sjöorren, som endast övervintrar<br />
i mindre antal i de svenska vattnen, visar<br />
de internationella inventeringarna en nedgång i<br />
Östersjöbeståndet (Skov et al. 2011). För ejdern<br />
som är en viktig häckfågel efter den svenska kusten<br />
har beståndet visat en mycket markant ökning<br />
från 1970-talet till senare delen av 1990-talet följt<br />
av vad som kan betecknas som en populationskrasch<br />
(Desholm et al. 2002, Ekroos et al. 2012).<br />
Denna minskning i ejderbeståndet noterades först<br />
för de övervintr<strong>and</strong>e ejdrarna främst i de danska<br />
farvattnen (Desholm et al. 2002). Huvuddelen av<br />
Östersjöns ejdrar övervintrar utanför de svenska<br />
farvattnen i främst i sydvästra Östersjön och Kattegatt<br />
samt Wadehavet, och någon minskning har<br />
inte setts i det svenska vinterbeståndet.<br />
SOWBAS rapporten (Skov et al. 2011) visar<br />
också en nedgång för det övervintr<strong>and</strong>e beståndet<br />
av småskrake i Östersjön. Regionalt konstaterades<br />
minskningar för de flesta områden, men de svenska<br />
midvinterinventeringarna visar en ök<strong>and</strong>e trend.<br />
Underlaget för att bedöma populationsförändringar<br />
hos arten är emellertid inte det bästa eftersom bl.a.<br />
viktiga svenska farvatten inte var adekvat representerade<br />
i de större inventeringarna. Som kontrast<br />
till minskningarna hos de övervintr<strong>and</strong>e bestånden<br />
av dykänder i uthavsområdena visar flertalet av de<br />
dykänder som övervintrar nära kusterna, liksom<br />
övriga dykänder, ök<strong>and</strong>e eller stabila vinterbestånd<br />
(jfr Nilsson 2008).<br />
59