
You also want an ePaper? Increase the reach of your titles
YUMPU automatically turns print PDFs into web optimized ePapers that Google loves.
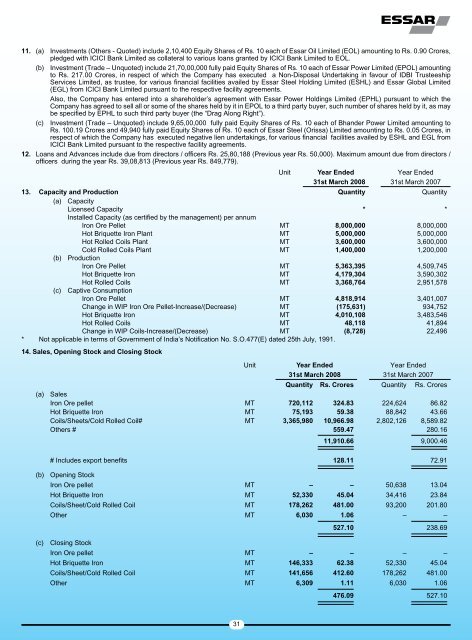
11. (a) Investments (Others - Quoted) include 2,10,400 Equity Shares of Rs. 10 each of Essar Oil Limited (EOL) amounting to Rs. 0.90 Crores,pledged with ICICI Bank Limited as collateral to various loans granted by ICICI Bank Limited to EOL.(b) Investment (Trade – Unquoted) include 21,70,00,000 fully paid Equity Shares of Rs. 10 each of Essar Power Limited (EPOL) amountingto Rs. 217.00 Crores, in respect of which the Company has executed a Non-Disposal Undertaking in favour of IDBI TrusteeshipServices Limited, as trustee, for various financial facilities availed by Essar Steel Holding Limited (ESHL) and Essar Global Limited(EGL) from ICICI Bank Limited pursuant to the respective facility agreements.Also, the Company has entered into a shareholder’s agreement with Essar Power Holdings Limited (EPHL) pursuant to which theCompany has agreed to sell all or some of the shares held by it in EPOL to a third party buyer, such number of shares held by it, as maybe specified by EPHL to such third party buyer (the “Drag Along Right”).(c) Investment (Trade – Unquoted) include 9,<strong>65</strong>,00,000 fully paid Equity Shares of Rs. 10 each of Bhander Power Limited amounting toRs. 100.19 Crores and 49,940 fully paid Equity Shares of Rs. 10 each of Essar Steel (Orissa) Limited amounting to Rs. 0.05 Crores, inrespect of which the Company has executed negative lien undertakings, for various financial facilities availed by ESHL and EGL fromICICI Bank Limited pursuant to the respective facility agreements.12. Loans and Advances include due from directors / officers Rs. 25,80,188 (Previous year Rs. 50,000). Maximum amount due from directors /officers during the year Rs. 39,08,813 (Previous year Rs. 849,779).UnitYear Ended31st March 2008Year Ended31st March 200713. Capacity and Production Quantity Quantity(a) CapacityLicensed Capacity * *Installed Capacity (as certified by the management) per annumIron Ore Pellet MT 8,000,000 8,000,000Hot Briquette Iron Plant MT 5,000,000 5,000,000Hot Rolled Coils Plant MT 3,600,000 3,600,000Cold Rolled Coils Plant MT 1,400,000 1,200,000(b) ProductionIron Ore Pellet MT 5,363,395 4,509,745Hot Briquette Iron MT 4,179,304 3,590,302Hot Rolled Coils MT 3,368,764 2,951,578(c) Captive ConsumptionIron Ore Pellet MT 4,818,914 3,401,007Change in WIP Iron Ore Pellet-Increase/(Decrease) MT (175,631) 934,752Hot Briquette Iron MT 4,010,108 3,483,546Hot Rolled Coils MT 48,118 41,894Change in WIP Coils-Increase/(Decrease) MT (8,728) 22,496* Not applicable in terms of Government of India’s Notification No. S.O.477(E) dated 25th July, 1991.14. Sales, Opening Stock and Closing StockUnitYear Ended31st March 2008Year Ended31st March 2007Quantity Rs. Crores Quantity Rs. Crores(a) SalesIron Ore pellet MT 720,112 324.83 224,624 86.82Hot Briquette Iron MT 75,193 59.38 88,842 43.66Coils/Sheets/Cold Rolled Coil# MT 3,3<strong>65</strong>,980 10,966.98 2,802,126 8,589.82Others # 559.47 280.1611,910.66 9,000.46# Includes export benefits 128.11 72.91(b) Opening StockIron Ore pellet MT – – 50,638 13.04Hot Briquette Iron MT 52,330 45.04 34,416 23.84Coils/Sheet/Cold Rolled Coil MT 178,262 481.00 93,200 201.80Other MT 6,030 1.06 – –(c) Closing Stock527.10 238.69Iron Ore pellet MT – – – –Hot Briquette Iron MT 146,333 62.38 52,330 45.04Coils/Sheet/Cold Rolled Coil MT 141,<strong>65</strong>6 412.60 178,262 481.00Other MT 6,309 1.11 6,030 1.06476.09 527.1031