COMPANY GUIDANCE : PT CATUR SENTOSA ADIPRANA TBK
COMPANY GUIDANCE : PT CATUR SENTOSA ADIPRANA TBK
COMPANY GUIDANCE : PT CATUR SENTOSA ADIPRANA TBK
- No tags were found...

Create successful ePaper yourself
Turn your PDF publications into a flip-book with our unique Google optimized e-Paper software.
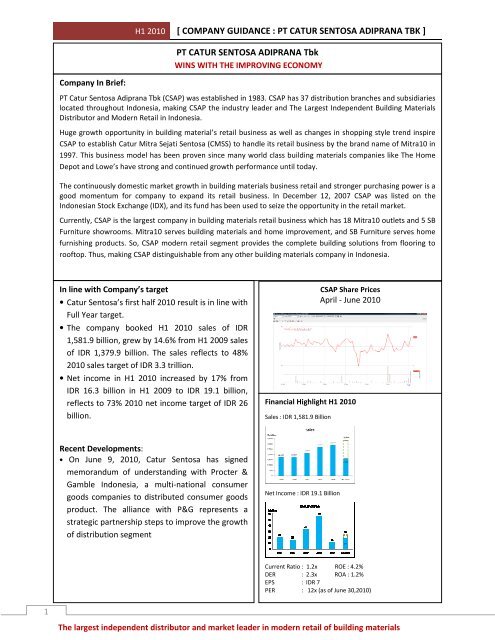
H1 2010 [ <strong>COMPANY</strong> <strong>GUIDANCE</strong> : <strong>PT</strong> <strong>CATUR</strong> <strong>SENTOSA</strong> <strong>ADIPRANA</strong> <strong>TBK</strong> ]<strong>PT</strong> <strong>CATUR</strong> <strong>SENTOSA</strong> <strong>ADIPRANA</strong> TbkWINS WITH THE IMPROVING ECONOMYCompany In Brief:<strong>PT</strong> Catur Sentosa Adiprana Tbk (CSAP) was established in 1983. CSAP has 37 distribution branches and subsidiarieslocated throughout Indonesia, making CSAP the industry leader and The Largest Independent Building MaterialsDistributor and Modern Retail in Indonesia.Huge growth opportunity in building material’s retail business as well as changes in shopping style trend inspireCSAP to establish Catur Mitra Sejati Sentosa (CMSS) to handle its retail business by the brand name of Mitra10 in1997. This business model has been proven since many world class building materials companies like The HomeDepot and Lowe’s have strong and continued growth performance until today.The continuously domestic market growth in building materials business retail and stronger purchasing power is agood momentum for company to expand its retail business. In December 12, 2007 CSAP was listed on theIndonesian Stock Exchange (IDX), and its fund has been used to seize the opportunity in the retail market.Currently, CSAP is the largest company in building materials retail business which has 18 Mitra10 outlets and 5 SBFurniture showrooms. Mitra10 serves building materials and home improvement, and SB Furniture serves homefurnishing products. So, CSAP modern retail segment provides the complete building solutions from flooring torooftop. Thus, making CSAP distinguishable from any other building materials company in Indonesia.In line with Company’s target• Catur Sentosa’s first half 2010 result is in line withFull Year target.• The company booked H1 2010 sales of IDR1,581.9 billion, grew by 14.6% from H1 2009 salesof IDR 1,379.9 billion. The sales reflects to 48%2010 sales target of IDR 3.3 trillion.• Net income in H1 2010 increased by 17% fromIDR 16.3 billion in H1 2009 to IDR 19.1 billion,reflects to 73% 2010 net income target of IDR 26billion.CSAP Share PricesApril - June 2010Financial Highlight H1 2010Sales : IDR 1,581.9 BillionRecent Developments:• On June 9, 2010, Catur Sentosa has signedmemorandum of understanding with Procter &Gamble Indonesia, a multi-national consumergoods companies to distributed consumer goodsproduct. The alliance with P&G represents astrategic partnership steps to improve the growthof distribution segmentNet Income : IDR 19.1 BillionCurrent Ratio : 1.2x ROE : 4.2%DER : 2.3x ROA : 1.2%EPS : IDR 7PER : 12x (as of June 30,2010)1The largest independent distributor and market leader in modern retail of building materials
H1 2010 [ <strong>COMPANY</strong> <strong>GUIDANCE</strong> : <strong>PT</strong> <strong>CATUR</strong> <strong>SENTOSA</strong> <strong>ADIPRANA</strong> <strong>TBK</strong> ]Financial SummaryHIGHLIGHT OF <strong>PT</strong> <strong>CATUR</strong> <strong>SENTOSA</strong> <strong>ADIPRANA</strong> <strong>TBK</strong> INCOME STATEMENTFor the periods ended Dec 31 & Jun 30(In IDR Bn)Audited Financial Statement for Unaudited Financial Statementthe Full Yearfor the 1st Semester2009 2008 % YOY H1 2010 H1 2009 % YOYNet Sales 2,874.3 2,711.6 6.0% 1,581.9 1,379.9 14.6%Cost of Sales 2,520.2 2,346.7 7.4% 1,383.9 1,204.7 14.9%Gross Profit 354.1 365.0 -3.0% 198.0 175.2 13.0%Operating Expenses 304.8 256.1 19.0% 157.3 148.1 6.2%Income from Operations 49.3 108.9 -54.7% 40.7 27.0 50.4%Interest Income 1.6 2.4 -34.2% 0.4 1.0 -60.4%Interest Expense -34.3 -22.7 51.6% -16.8 -17.1 -1.8%Income before income tax 22.2 91.5 -75.8% 28.5 24.9 14.7%Income Tax Expense -7.9 -29.5 -73.3% -7.4 -6.9 7.4%Net Income 11.3 56.2 -80.0% 19.1 16.3 17.0%HIGHLIGHT OF <strong>PT</strong> <strong>CATUR</strong> <strong>SENTOSA</strong> <strong>ADIPRANA</strong> <strong>TBK</strong> BALANCE SHEETAs of Dec 31 & Jun 30(In IDR Bn)Audited Financial Statement for Unaudited Financial Statementthe Full Yearfor the 1st semester2009 2008 % YOY H1 2010 H1 2009 % YOYCash and Cash Equivalents 33.4 37.1 -9.9% 27.3 29.7 -8.0%Account Receivables 382.1 336.7 13.5% 471.1 391.7 20.3%Total Current Assets 1,020.3 900.3 13.3% 1,138.9 999.7 13.9%Fixed Assets, net 289.1 267.7 8.0% 305.9 294.7 3.8%Total Non Current Assets 365.3 326.3 11.9% 391.9 358.5 9.3%TOTAL ASSETS 1,385.6 1,226.6 13.0% 1,530.8 1,358.2 12.7%Short Term Bank Loans 196.3 143.4 36.9% 289.8 209.1 38.6%Trade Payables 548.0 453.8 20.8% 567.8 518.6 9.5%Current Maturities of Long Term Debt 21.5 18.0 19.7% 21.6 17.2 25.4%Total Current Liabilities 804.8 661.0 21.8% 928.1 788.8 17.7%Total Non Current Liabilities 98.8 91.7 7.7% 99.5 87.2 14.1%Total Equity 436.9 437.4 -0.1% 456.2 442.0 3.2%2The largest independent distributor and market leader in modern retail of building materials
H1 2010 [ <strong>COMPANY</strong> <strong>GUIDANCE</strong> : <strong>PT</strong> <strong>CATUR</strong> <strong>SENTOSA</strong> <strong>ADIPRANA</strong> <strong>TBK</strong> ]HIGHLIGHT OF <strong>PT</strong> <strong>CATUR</strong> <strong>SENTOSA</strong> <strong>ADIPRANA</strong> <strong>TBK</strong> FINANCIAL RATIOAs of Dec 31 & Jun 302009 2008 % YOY H1 2010 H1 2009 % YOYCurrent Ratio 1.3 1.4 -7% 1.2 1.3 -3%Debt to Equity Ratio 2.1 1.7 20% 2.3 2.0 14%Age of Receivables (days) 44 41 7% 49 47 5%Age of Payables (days) 71 63 13% 67 70 -4%Age of Inventory (days) 76 72 6% 73 73 0%Cash Cycle (days) 48 50 -4% 55 49 13%Return on Equity 2.6% 12.9% -80% 4.2% 3.7% 13%Return on Assets 0.8% 4.6% -82% 1.2% 1.2% 4%Gross Profit Margin 12.3% 13.5% -8% 12.5% 12.7% -1%Operating Profit Margin 1.7% 4.0% -57% 2.6% 2.0% 31%Profit Before Tax Margin 0.8% 3.4% -77% 1.8% 1.8% 0%Net Profit Margin 0.4% 2.1% -81% 1.2% 1.2% 2%Total Asset Turnover 2.07 2.21 -6% 1.03 1.02 2%Business Segment<strong>PT</strong> <strong>CATUR</strong> <strong>SENTOSA</strong> <strong>ADIPRANA</strong> Tbk.Holding & Operating CompanyDistributionModern RetailBuilding MaterialsChemical ProductsConsumer GoodsBuilding Materials(Mitra10)Furniture(SB Furniture)Financial H1 2010 ResultThe company posted sales of IDR 1,581.9 billion in first half of 2010, an increase of 14.6% from first half2009 revenues amounted to IDR 1,379.9 billion. The increase was primarily driven by improvedconsumer purchasing power, marked by the controlled inflation and recovery in property sector. Thatsales reflects 48% to 2010 sales target of IDR 3,3 trillion.The biggest sales were contributed from the distribution segment as the backbone of company sales. Inthe first half of 2010, distribution sales reached IDR 1,250.6 billion, grew by 12.7% from sales in the first3The largest independent distributor and market leader in modern retail of building materials
H1 2010 [ <strong>COMPANY</strong> <strong>GUIDANCE</strong> : <strong>PT</strong> <strong>CATUR</strong> <strong>SENTOSA</strong> <strong>ADIPRANA</strong> <strong>TBK</strong> ]semester of 2009 amounted to IDR 1,109.9 billion. The sales had reached 47% of its sales target this yearamounted to IDR 2,640 billion. Sales from the distribution segment contributing 79% of total sales.Meanwhile, sales from retail segment grew faster by 22.7% from IDR 270 billion to IDR 331.2 billion. Thesales is already reaching 50% of its sales target this year amounted to IDR 660 billion. The high salesgrowth in retail segment is consistent with CSAP’s strategies that make the retail segment as a source ofcompany growth.The sales growth means a higher productivity of Mitra10 stores from average IDR 1.3 million/m 2 /monthin first half of 2009 to average IDR 1.5 million/m 2 /month in first half of 2010 (increase 15% inproductivity).Sales by product category are dominated by ceramics and paints. The high sales of them indicate thatthe two products are the main base material for renovation activities. Ceramics sales reached IDR 595.7billion, grew by 10.9% from IDR 537.2 billion, with contributions amounting to 37.7% of total sales. Paintsales reach IDR 518.4 billion, grew by 15% from IDR 450.7 billion with contributions amounting to 32.8%of total sales.The company also recorded a higher than-revenue increase in net income. Net income increased fromIDR 16.3 in the first half of 2009 to IDR 19.1 billion in the first half of 2010, an increase of 17%. Thus, EPSper share increased from IDR 6/share to IDR 7/share. Company’s performance result in H1 2010 is in linewith company’s financial 2010 target.In the first semester of 2010, the company experienced a fairly increase in margins, particularly theoperating margin. Operating margin increased from 2% to 2.6% due to cost improvement on salespromotion expenses and rental costs.SALES BY BUSINESS SEGMENTH1 2010 % H1 2009 % Growth 2010 Target % of targetDistribution 1,250.6 79.1% 1,109.9 80.4% 12.7% 2,640 47%Modern Retail 331.2 20.9% 270.0 19.6% 22.7% 660 50%Total 1,581.9 100% 1,379.9 100% 14.6% 3,300 48%(In Billion IDR)4The largest independent distributor and market leader in modern retail of building materials
.H1H1 2010 [ <strong>COMPANY</strong> <strong>GUIDANCE</strong> : <strong>PT</strong> <strong>CATUR</strong> <strong>SENTOSA</strong> <strong>ADIPRANA</strong> <strong>TBK</strong> ]Sales of Distribution Segment(2006 - H1 2010)2,640*Sales of Modern Retail Segment(2006 - H1 2010)660*2,2162,3554965191,7743601,4441,2512633312006 2007 2008 2009 H1 2010(In billion IDR, * FY 2010 target)2006 2007 2008 2009 H1 2010(In billion IDR, * FY 2010 target)SALES BY PRODUCT CATEGORY2010 % H1 2009 % GrowthCeramic tiles 595.7 37.7% 537.2 38.9% 10.9%Paints 518.4 32.8% 450.7 32.7% 15.0%Chemicals 107.6 6.8% 94.8 6.9% 13.5%Electrical Appliance 42.6 2.7% 35.4 2.6% 20.1%Sanitation & kitchen products 67.9 4.3% 53.2 3.9% 27.7%Glass and Glass Block 55.6 3.5% 45.2 3.3% 23.2%Others 194.2 12.3% 163.5 11.8% 18.8%Total 1581.9 100% 1379.9 100% 14.6%(In Billion IDR)Recent DevelopmentsOn June 9, 2010, Catur Sentosa has signed memorandum of understanding with Procter &Gamble Indonesia, a multi-national consumer goods companies to distribute consumer goodsproducts. The alliance with P&G represents a strategic partnership step to improve the growthof distribution segment. P&G has very strict requirements in the distribution business. Thus,only a very selected and competent company is chosen to be P&G’s partner.The Company previously has expertise and long experience in the distribution business of buildingmaterials and chemicals. With its experience, skills, network and facilities, the Company is confident andoptimistic to perform the new consumer goods distribution division. For the beginning, Catur Sentosawill distribute P&G’s products to the traditional retailer at Jakarta, Bogor, Depok, Tangerang and Serang.In 2010, distribution segment is expected to contribute 80% of 2010 sales target (IDR 3.3 trillion), whilethe remaining will be contributed from retail segment.5The largest independent distributor and market leader in modern retail of building materials
H1 2010 [ <strong>COMPANY</strong> <strong>GUIDANCE</strong> : <strong>PT</strong> <strong>CATUR</strong> <strong>SENTOSA</strong> <strong>ADIPRANA</strong> <strong>TBK</strong> ]Any comment is welcomed and to be sent to:INVESTOR RELATIONSJl. Daan Mogot Raya No. 234Jakarta 11510Tel +6221 567 2622+6221 566 8801Fax +6221 566 9445corsec@csahome.comwww.csahome.comDisclaimer:This report is prepared by <strong>PT</strong>. Catur Sentosa Adiprana Tbk independently and is circulated for the purpose of general informationonly. It is not intended to the specific person who may receive this report. No warranty (expressed or implied) is made to theaccuracy or completeness of the information. Some of the statements contained in this document contain “forward looking”statements with respect to the financial conditions, results of operations and businesses, and related plans and objectives. TheseStatements do not directly or exclusively relate to historical facts and reflect the Company’s current intentions, plans,expectations, assumptions and beliefs about future events. The Statements involve known and unknown risks and uncertaintiesthat could cause actual results, performance or events to differ materially from those in the statements as originally made. Suchstatements are not, and should not be construed as a representation to future performance of the Company. Readers are urged toview all forward-looking statements contained herein with caution.6The largest independent distributor and market leader in modern retail of building materials