Numerical Analysis
Numerical Analysis - Orchard Publications
Numerical Analysis - Orchard Publications
- No tags were found...

You also want an ePaper? Increase the reach of your titles
YUMPU automatically turns print PDFs into web optimized ePapers that Google loves.
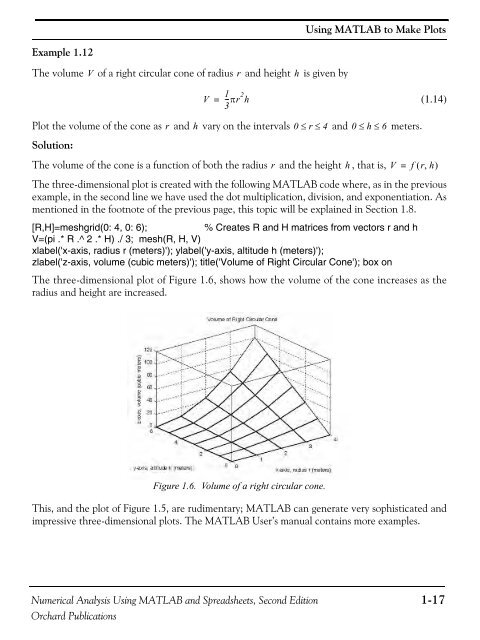
Using MATLAB to Make PlotsExample 1.12The volume V of a right circular cone of radius r and height h is given byV=1--πr 2 h3(1.14)Plot the volume of the cone as r and h vary on the intervals 0 ≤r≤ 4 and 0 ≤h≤6 meters.Solution:The volume of the cone is a function of both the radius r and the height h, that is, V = f ( r,h)The three-dimensional plot is created with the following MATLAB code where, as in the previousexample, in the second line we have used the dot multiplication, division, and exponentiation. Asmentioned in the footnote of the previous page, this topic will be explained in Section 1.8.[R,H]=meshgrid(0: 4, 0: 6);% Creates R and H matrices from vectors r and hV=(pi .* R .^ 2 .* H) ./ 3; mesh(R, H, V)xlabel('x-axis, radius r (meters)'); ylabel('y-axis, altitude h (meters)');zlabel('z-axis, volume (cubic meters)'); title('Volume of Right Circular Cone'); box onThe three-dimensional plot of Figure 1.6, shows how the volume of the cone increases as theradius and height are increased.Figure 1.6. Volume of a right circular cone.This, and the plot of Figure 1.5, are rudimentary; MATLAB can generate very sophisticated andimpressive three-dimensional plots. The MATLAB User’s manual contains more examples.<strong>Numerical</strong> <strong>Analysis</strong> Using MATLAB and Spreadsheets, Second Edition 1-17Orchard Publications