Numerical Analysis
Numerical Analysis - Orchard Publications
Numerical Analysis - Orchard Publications
- No tags were found...

You also want an ePaper? Increase the reach of your titles
YUMPU automatically turns print PDFs into web optimized ePapers that Google loves.
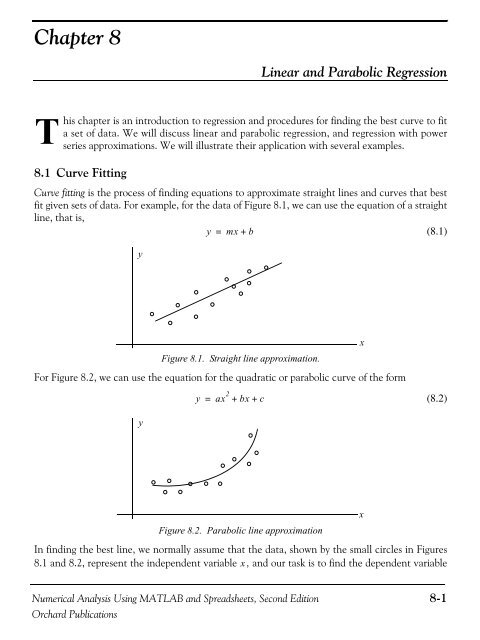
Chapter 8Linear and Parabolic RegressionThis chapter is an introduction to regression and procedures for finding the best curve to fita set of data. We will discuss linear and parabolic regression, and regression with powerseries approximations. We will illustrate their application with several examples.8.1 Curve FittingCurve fitting is the process of finding equations to approximate straight lines and curves that bestfit given sets of data. For example, for the data of Figure 8.1, we can use the equation of a straightline, that is,y = mx+b(8.1)yFigure 8.1. Straight line approximation.For Figure 8.2, we can use the equation for the quadratic or parabolic curve of the formxy = ax 2 + bx + c(8.2)yxFigure 8.2. Parabolic line approximationIn finding the best line, we normally assume that the data, shown by the small circles in Figures8.1 and 8.2, represent the independent variable x , and our task is to find the dependent variable<strong>Numerical</strong> <strong>Analysis</strong> Using MATLAB and Spreadsheets, Second Edition 8-1Orchard Publications