à¸à¸²à¸§à¸à¹à¹à¸«à¸¥à¸à¹à¸à¸¥à¹ à¸à¸µ 2552 .pdf - สำà¸à¸±à¸à¸à¸²à¸à¹à¸¨à¸£à¸©à¸à¸à¸´à¸à¸à¸²à¸£à¹à¸à¸©à¸à¸£
à¸à¸²à¸§à¸à¹à¹à¸«à¸¥à¸à¹à¸à¸¥à¹ à¸à¸µ 2552 .pdf - สำà¸à¸±à¸à¸à¸²à¸à¹à¸¨à¸£à¸©à¸à¸à¸´à¸à¸à¸²à¸£à¹à¸à¸©à¸à¸£
à¸à¸²à¸§à¸à¹à¹à¸«à¸¥à¸à¹à¸à¸¥à¹ à¸à¸µ 2552 .pdf - สำà¸à¸±à¸à¸à¸²à¸à¹à¸¨à¸£à¸©à¸à¸à¸´à¸à¸à¸²à¸£à¹à¸à¸©à¸à¸£
- No tags were found...

Create successful ePaper yourself
Turn your PDF publications into a flip-book with our unique Google optimized e-Paper software.
ละหุง : Castor beans<br />
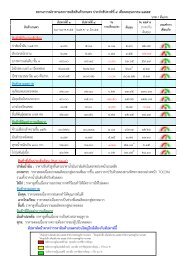
ตารางที่ 32 ละหุง : เนื้อที่เพาะปลูก ผลผลิต ผลผลิตตอไร ราคา และมูลคาของผลผลิตตามราคาที่เกษตรกรขายได<br />
ป 2543 - <strong>2552</strong><br />
Table 32 Castor beans : Planted area, production, yield, farm price and farm value, 2000 - 2009<br />
ป<br />
ราคา มูลคาของผลผลิต<br />
เนื้อที่เพาะปลูก ผลผลิต ผลผลิตตอไร1/ ที่เกษตรกร ตามราคาที่<br />
(ไร) (ตัน) (กก.) ขายได เกษตรกรขายได<br />
Planted area Production Yield per rai (บาท/กก.) (ลานบาท)<br />
(Rais) (Tons) (Kgs.) Farm price Farm value<br />
(Baht per kg.) (Million baht)<br />
2543 81,837 8,593 105 10.71 92,031 2000<br />
2544 84,387 9,029 107 10.00 90,290 2001<br />
2545 86,055 9,724 113 9.63 93,642 2002<br />
2546 87,076 9,927 114 9.25 91,825 2003<br />
2547 83,165 9,813 118 9.63 94,499 2004<br />
2548 83,795 10,391 124 9.90 102,871 2005<br />
2549 80,725 10,171 126 8.87 90,217 2006<br />
2550 81,346 10,982 135 10.00 109,820 2007<br />
2551 82,103 11,330 138 11.71 132,674 2008<br />
<strong>2552</strong> 82,834 11,680 141 12.00 140,160 2009<br />
หมายเหตุ : 1/ ผลผลิตตอเนื้อที่เพาะปลูก Remark : 1/ Yield per rai from planted area<br />
Year<br />
รูปที่ 13 ละหุง : เนื้อที่เพาะปลูก ผลผลิต และผลผลิตตอไร ป 2543 - <strong>2552</strong><br />
Figure 13 Castor beans : Planted area, production and yield, 2000 - 2009<br />
37<br />
สถิติการเกษตรของประเทศไทย<br />
Agricultural Statistics of Thailand