- Page 1 and 2:
TRANSPORTATION STUDY Town of Collin
- Page 3 and 4:
5.1 Development Lands 34 5.2 Trip G
- Page 5 and 6:
List of Tables Table 1: Town of Col
- Page 7 and 8:
Table 46: Intersection Operations -
- Page 9 and 10:
1 Introduction 1.1 Purpose The Town
- Page 11 and 12:
2 Existing Conditions This chapter
- Page 13 and 14:
The locations of the 16 intersectio
- Page 15 and 16:
Table 3: Intersection Operations (u
- Page 17 and 18:
Table 4: Road Section Operations -
- Page 19 and 20:
• left turn lanes on all approach
- Page 21 and 22:
3.4 Background Traffic Volumes Futu
- Page 23 and 24:
Table 6: Trip Generation Estimates
- Page 25 and 26:
4 Future Background Operations This
- Page 27 and 28:
Table 9: Intersection Operations (u
- Page 29 and 30:
Table 11: Road Section Operations -
- Page 31 and 32:
Table 12: Intersection Operations (
- Page 33 and 34:
Table 14: Intersection Operations (
- Page 35 and 36:
High Street & Third Street The inte
- Page 37 and 38:
Table 17: Road Section Operations -
- Page 39 and 40:
intersection configuration. For bot
- Page 41 and 42:
drawbacks, the all-way stop is a le
- Page 43 and 44:
5.1.2 RCD Development The function
- Page 45 and 46:
Table 20: Trip Generation Rates - i
- Page 47 and 48:
• free-standing discount supersto
- Page 49 and 50:
trip within the site. For shared/in
- Page 51 and 52:
• West Collingwood (Zone 8566);
- Page 53 and 54:
6 Transportation Impacts This chapt
- Page 55 and 56:
Table 32: Intersection Operations (
- Page 57 and 58:
Table 34: High Street & First Stree
- Page 59 and 60:
Table 35: Road Section Operations -
- Page 61 and 62:
Intersection and Movement Control W
- Page 63 and 64:
equire more costly improvements suc
- Page 65 and 66:
Tenth Line & Mountain Road The inte
- Page 67 and 68:
exceeded by 6 to 11% in the AM and
- Page 69 and 70:
assigned to other intersections as
- Page 71 and 72:
Table 41: Roundabout vs. Signals -
- Page 73 and 74:
Table 43: Roundabout vs. Signals -
- Page 75 and 76:
Hume Street/Highway 26 & Pretty Riv
- Page 77 and 78:
Table 45: Intersection Operations -
- Page 79 and 80:
Table 46: Intersection Operations -
- Page 81 and 82:
turn lane. It is therefore recommen
- Page 83 and 84:
Intersection and Movement Control W
- Page 85 and 86:
Table 49: Intersection Operations -
- Page 87 and 88:
assumed for both scenarios. The res
- Page 89 and 90:
Notwithstanding, it is recognized t
- Page 91 and 92:
proper designated crossing points t
- Page 93 and 94:
Table 54: Medium Term Recommendatio
- Page 95 and 96:
Program Item & Improvement Cost EA
- Page 97 and 98:
N Complete Community Regional Comme
- Page 99 and 100:
N Collingwood Transportation Study
- Page 101 and 102:
N 1) Highway 26 & Harbour Street We
- Page 103 and 104:
N 9) Tenth Line & Mountain Road 10)
- Page 105 and 106:
Hig ghway 26 (592) 538 489 (675) (6
- Page 107 and 108:
N Collingwood Transportation Study
- Page 109 and 110:
Highway 26 (450) 500 320 (660) (50)
- Page 111 and 112:
Hig ghway 26 (1115) 1100 870 (1415)
- Page 113 and 114:
9 1 8 2 3 4 5 6 16 15 N 1. Highway
- Page 115 and 116:
8566 West Collingwood 8567 South Co
- Page 117 and 118:
Highway 26 (70) 40 30 (105) (0) (70
- Page 119 and 120:
(1185) 1140 900 (1520) (60) (1100)
- Page 121 and 122:
9 1 8 2 3 4 5 6 16 15 N 1. Highway
- Page 123 and 124:
Highway 26 N Harbour St W Balsam St
- Page 125 and 126:
Appendix A: 2010 Traffic Counts
- Page 127 and 128:
INTERSECTION COUNT PM PEAK HOUR GEN
- Page 129 and 130:
INTERSECTION COUNT PM PEAK HOUR GEN
- Page 131 and 132:
INTERSECTION COUNT PM PEAK HOUR GEN
- Page 133 and 134:
INTERSECTION COUNT PM PEAK HOUR GEN
- Page 135 and 136:
INTERSECTION COUNT PM PEAK HOUR GEN
- Page 137 and 138:
INTERSECTION COUNT PM PEAK HOUR GEN
- Page 139 and 140:
INTERSECTION COUNT PM PEAK HOUR GEN
- Page 141 and 142:
INTERSECTION COUNT PM PEAK HOUR GEN
- Page 143 and 144:
INTERSECTION COUNT PM PEAK HOUR GEN
- Page 145 and 146:
INTERSECTION COUNT PM PEAK HOUR GEN
- Page 147 and 148:
INTERSECTION COUNT PM PEAK HOUR GEN
- Page 149 and 150:
INTERSECTION COUNT PM PEAK HOUR GEN
- Page 151 and 152:
INTERSECTION COUNT PM PEAK HOUR GEN
- Page 153 and 154:
INTERSECTION COUNT PM PEAK HOUR GEN
- Page 155 and 156:
INTERSECTION COUNT PM PEAK HOUR GEN
- Page 157 and 158:
INTERSECTION COUNT PM PEAK HOUR GEN
- Page 159 and 160:
CAPACITY ANALYSIS AT SIGNALIZED INT
- Page 161 and 162:
3: Harbour Street West & Highway 26
- Page 163 and 164: 9: Old Mountain Road & Balsam Stree
- Page 165 and 166: 15: Mountain Road & Old Mountain Ro
- Page 167 and 168: 19: Home Depot Access & High Street
- Page 169 and 170: 25: Sixth Street & High Street 2010
- Page 171 and 172: 3: Harbour Street West & Highway 26
- Page 173 and 174: 9: Old Mountain Road & Balsam Stree
- Page 175 and 176: 15: Mountain Road & Old Mountain Ro
- Page 177 and 178: 19: Home Depot Access & High Street
- Page 179 and 180: 25: Sixth Street & High Street 2010
- Page 181 and 182: Appendix C: 2012 Development Activi
- Page 183 and 184: Appendix D: 2020 Background Operati
- Page 185 and 186: 6: Balsam Street & Commercial Acces
- Page 187 and 188: 14: High Street/Balsam Street & Fir
- Page 189 and 190: 16: Tenth Line & Mountain Road 2020
- Page 191 and 192: 22: High Street & Third Street 2020
- Page 193 and 194: 26: Tenth Line & Sixth Street 2020
- Page 195 and 196: 6: Balsam Street & Commercial Acces
- Page 197 and 198: 14: High Street/Balsam Street & Fir
- Page 199 and 200: 16: Tenth Line & Mountain Road 2020
- Page 201 and 202: 22: High Street & Third Street 2020
- Page 203 and 204: 26: Tenth Line & Sixth Street 2020
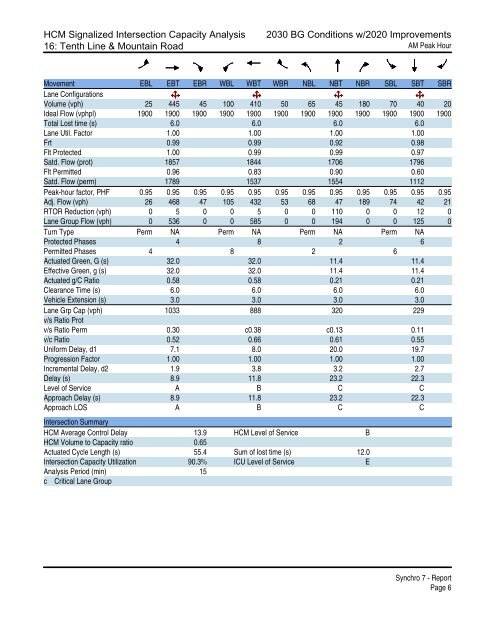
- Page 205 and 206: 16: Tenth Line & Mountain Road 2020
- Page 207 and 208: 16: Tenth Line & Mountain Road 2020
- Page 209 and 210: HCM Signalized Intersection Capacit
- Page 211 and 212: HCM Signalized Intersection Capacit
- Page 213: HCM Signalized Intersection Capacit
- Page 217 and 218: HCM Signalized Intersection Capacit
- Page 219 and 220: HCM Signalized Intersection Capacit
- Page 221 and 222: HCM Signalized Intersection Capacit
- Page 223 and 224: HCM Signalized Intersection Capacit
- Page 225 and 226: HCM Signalized Intersection Capacit
- Page 227 and 228: HCM Signalized Intersection Capacit
- Page 229 and 230: HCM Signalized Intersection Capacit
- Page 231 and 232: HCM Unsignalized Intersection Capac
- Page 233 and 234: HCM Signalized Intersection Capacit
- Page 235 and 236: HCM Signalized Intersection Capacit
- Page 237 and 238: HCM Signalized Intersection Capacit
- Page 239 and 240: HCM Signalized Intersection Capacit
- Page 241 and 242: Appendix F: 2020 Total Operations
- Page 243 and 244: 6: Balsam Street & Commercial Acces
- Page 245 and 246: 14: High Street/Balsam Street & Fir
- Page 247 and 248: 16: Tenth Line & Mountain Road 2020
- Page 249 and 250: 22: High Street & Third Street 2020
- Page 251 and 252: 26: Tenth Line & Sixth Street 2020
- Page 253 and 254: 6: Balsam Street & Commercial Acces
- Page 255 and 256: 14: High Street/Balsam Street & Fir
- Page 257 and 258: 16: Tenth Line & Mountain Road 2020
- Page 259 and 260: 22: High Street & Third Street 2020
- Page 261 and 262: 26: Tenth Line & Sixth Street 2020
- Page 263 and 264: HCM Signalized Intersection Capacit
- Page 265 and 266:
HCM Signalized Intersection Capacit
- Page 267 and 268:
HCM Signalized Intersection Capacit
- Page 269 and 270:
HCM Signalized Intersection Capacit
- Page 271 and 272:
HCM Signalized Intersection Capacit
- Page 273 and 274:
HCM Signalized Intersection Capacit
- Page 275 and 276:
HCM Signalized Intersection Capacit
- Page 277 and 278:
HCM Signalized Intersection Capacit
- Page 279 and 280:
HCM Signalized Intersection Capacit
- Page 281 and 282:
HCM Signalized Intersection Capacit
- Page 283 and 284:
HCM Signalized Intersection Capacit
- Page 285 and 286:
HCM Signalized Intersection Capacit
- Page 287 and 288:
HCM Signalized Intersection Capacit
- Page 289 and 290:
HCM Signalized Intersection Capacit
- Page 291 and 292:
HCM Signalized Intersection Capacit
- Page 293 and 294:
HCM Signalized Intersection Capacit
- Page 295 and 296:
HCM Signalized Intersection Capacit
- Page 297 and 298:
HCM Signalized Intersection Capacit
- Page 299 and 300:
Appendix H: Other Major Intersectio
- Page 301 and 302:
31: Hume Street & Hurontario Street
- Page 303 and 304:
40: Poplar Sideroad & Tenth Line 20
- Page 305 and 306:
42: Poplar Sideroad & Sixth Line 20
- Page 307 and 308:
31: Hume Street & Hurontario Street
- Page 309 and 310:
40: Poplar Sideroad & Tenth Line 20
- Page 311 and 312:
42: Poplar Sideroad & Sixth Line 20
- Page 313 and 314:
31: Hume Street & Hurontario Street
- Page 315 and 316:
40: Poplar Sideroad & Tenth Line 20
- Page 317 and 318:
42: Poplar Sideroad & Sixth Line 20
- Page 319 and 320:
31: Hume Street & Hurontario Street
- Page 321 and 322:
40: Poplar Sideroad & Tenth Line 20
- Page 323 and 324:
42: Poplar Sideroad & Sixth Line 20
- Page 325 and 326:
HCM Signalized Intersection Capacit
- Page 327 and 328:
HCM Unsignalized Intersection Capac
- Page 329 and 330:
HCM Unsignalized Intersection Capac
- Page 331 and 332:
HCM Signalized Intersection Capacit
- Page 333 and 334:
HCM Unsignalized Intersection Capac
- Page 335 and 336:
HCM Unsignalized Intersection Capac
- Page 337 and 338:
31: Hurontario Street & Hume Street
- Page 339 and 340:
40: Tenth Line & Poplar Sideroad 20
- Page 341 and 342:
42: Sixth Line & Poplar Sideroad 20
- Page 343 and 344:
31: Hurontario Street & Hume Street
- Page 345 and 346:
40: Tenth Line & Poplar Sideroad 20
- Page 347 and 348:
42: Sixth Line & Poplar Sideroad 20
- Page 349 and 350:
31: Hurontario Street & Hume Street
- Page 351 and 352:
42: Sixth Line & Poplar Sideroad 20
- Page 353 and 354:
31: Hurontario Street & Hume Street
- Page 355 and 356:
42: Sixth Line & Poplar Sideroad 20
- Page 357 and 358:
8-HOUR TRAFFIC SIGNAL WARRANT Proje
- Page 359 and 360:
8-HOUR TRAFFIC SIGNAL WARRANT Proje
- Page 361 and 362:
8-HOUR TRAFFIC SIGNAL WARRANT Proje
- Page 363 and 364:
Appendix J: Diversion Scenario Anal
- Page 365 and 366:
HCM Signalized Intersection Capacit
- Page 367 and 368:
HCM Signalized Intersection Capacit
- Page 369 and 370:
HCM Signalized Intersection Capacit
- Page 371 and 372:
HCM Signalized Intersection Capacit
- Page 373 and 374:
16: Tenth Line & Mountain Road 2020
- Page 375 and 376:
16: Tenth Line & Mountain Road 2030
- Page 377 and 378:
16: Tenth Line & Mountain Road 2020
- Page 379 and 380:
HCM 2010 Roundabout 2030 Total - w/
- Page 381 and 382:
26: Tenth Line & Sixth Street 2020
- Page 383 and 384:
26: Tenth Line & Sixth Street 2030
- Page 385 and 386:
26: Tenth Line & Sixth Street 2020
- Page 387 and 388:
26: Tenth Line & Sixth Street 2030
- Page 389 and 390:
41: Poplar Sideroad & Raglan Street
- Page 391 and 392:
41: Poplar Sideroad & Raglan Street
- Page 393 and 394:
41: Poplar Sideroad & Raglan Street
- Page 395 and 396:
41: Poplar Sideroad & Raglan Street
- Page 397 and 398:
42: Sixth Line & Poplar Sideroad 20
- Page 399 and 400:
42: Sixth Line & Poplar Sideroad 20
- Page 401 and 402:
42: Sixth Line & Poplar Sideroad 20
- Page 403 and 404:
42: Sixth Line & Poplar Sideroad 20