

Research Journal of Social Science & Management - RJSSM - The ...
Research Journal of Social Science & Management - RJSSM - The ...
Research Journal of Social Science & Management - RJSSM - The ...

You also want an ePaper? Increase the reach of your titles
YUMPU automatically turns print PDFs into web optimized ePapers that Google loves.
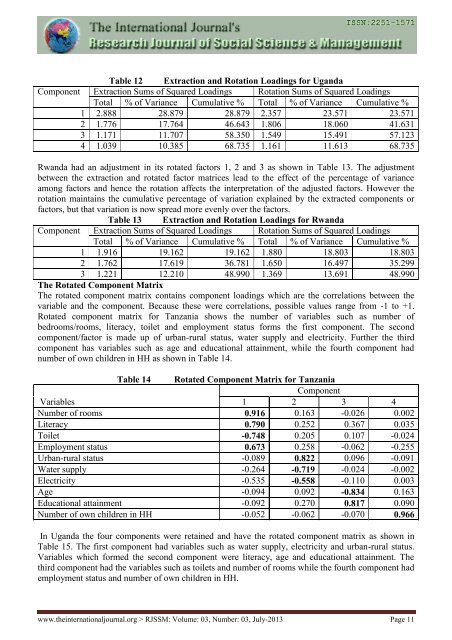
Table 12 Extraction and Rotation Loadings for Uganda<br />
Component Extraction Sums <strong>of</strong> Squared Loadings Rotation Sums <strong>of</strong> Squared Loadings<br />
Total % <strong>of</strong> Variance Cumulative % Total % <strong>of</strong> Variance Cumulative %<br />
1 2.888 28.879 28.879 2.357 23.571 23.571<br />
2 1.776 17.764 46.643 1.806 18.060 41.631<br />
3 1.171 11.707 58.350 1.549 15.491 57.123<br />
4 1.039 10.385 68.735 1.161 11.613 68.735<br />
Rwanda had an adjustment in its rotated factors 1, 2 and 3 as shown in Table 13. <strong>The</strong> adjustment<br />
between the extraction and rotated factor matrices lead to the effect <strong>of</strong> the percentage <strong>of</strong> variance<br />
among factors and hence the rotation affects the interpretation <strong>of</strong> the adjusted factors. However the<br />
rotation maintains the cumulative percentage <strong>of</strong> variation explained by the extracted components or<br />
factors, but that variation is now spread more evenly over the factors.<br />
Table 13 Extraction and Rotation Loadings for Rwanda<br />
Component Extraction Sums <strong>of</strong> Squared Loadings Rotation Sums <strong>of</strong> Squared Loadings<br />
Total % <strong>of</strong> Variance Cumulative % Total % <strong>of</strong> Variance Cumulative %<br />
1 1.916 19.162 19.162 1.880 18.803 18.803<br />
2 1.762 17.619 36.781 1.650 16.497 35.299<br />
3 1.221 12.210 48.990 1.369 13.691 48.990<br />
<strong>The</strong> Rotated Component Matrix<br />
<strong>The</strong> rotated component matrix contains component loadings which are the correlations between the<br />
variable and the component. Because these were correlations, possible values range from -1 to +1.<br />
Rotated component matrix for Tanzania shows the number <strong>of</strong> variables such as number <strong>of</strong><br />
bedrooms/rooms, literacy, toilet and employment status forms the first component. <strong>The</strong> second<br />
component/factor is made up <strong>of</strong> urban-rural status, water supply and electricity. Further the third<br />
component has variables such as age and educational attainment, while the fourth component had<br />
number <strong>of</strong> own children in HH as shown in Table 14.<br />
Table 14 Rotated Component Matrix for Tanzania<br />
Component<br />
Variables<br />
1 2 3 4<br />
Number <strong>of</strong> rooms 0.916 0.163 -0.026 0.002<br />
Literacy 0.790 0.252 0.367 0.035<br />
Toilet -0.748 0.205 0.107 -0.024<br />
Employment status 0.673 0.258 -0.062 -0.255<br />
Urban-rural status -0.089 0.822 0.096 -0.091<br />
Water supply -0.264 -0.719 -0.024 -0.002<br />
Electricity -0.535 -0.558 -0.110 0.003<br />
Age -0.094 0.092 -0.834 0.163<br />
Educational attainment -0.092 0.270 0.817 0.090<br />
Number <strong>of</strong> own children in HH -0.052 -0.062 -0.070 0.966<br />
In Uganda the four components were retained and have the rotated component matrix as shown in<br />
Table 15. <strong>The</strong> first component had variables such as water supply, electricity and urban-rural status.<br />
Variables which formed the second component were literacy, age and educational attainment. <strong>The</strong><br />
third component had the variables such as toilets and number <strong>of</strong> rooms while the fourth component had<br />
employment status and number <strong>of</strong> own children in HH.<br />
www.theinternationaljournal.org > <strong>RJSSM</strong>: Volume: 03, Number: 03, July-2013 Page 11


