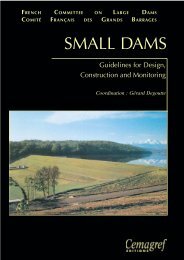
SMALL DAMS
SMALL DAMS - Comité Français des Barrages et Réservoirs
SMALL DAMS - Comité Français des Barrages et Réservoirs
- No tags were found...

You also want an ePaper? Increase the reach of your titles
YUMPU automatically turns print PDFs into web optimized ePapers that Google loves.
P reliminary determination of design flood<br />
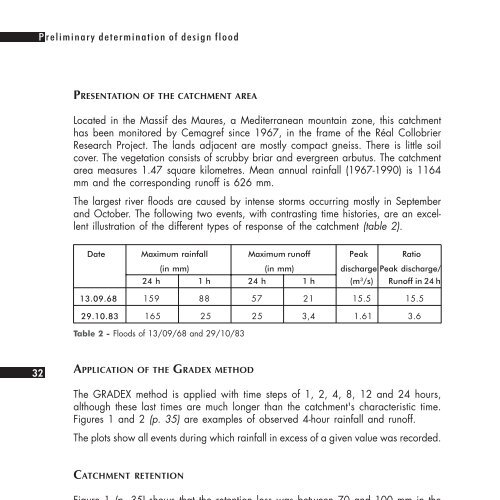
PRESENTATION OF THE CATCHMENT AREA<br />
Located in the Massif des Maures, a Mediterranean mountain zone, this catchment<br />
has been monitored by Cemagref since 1967, in the frame of the Réal Collobrier<br />
Research Project. The lands adjacent are mostly compact gneiss. There is little soil<br />
cover. The vegetation consists of scrubby briar and evergreen arbutus. The catchment<br />
area measures 1.47 square kilometres. Mean annual rainfall (1967-1990) is 1164<br />
mm and the corresponding runoff is 626 mm.<br />
The largest river floods are caused by intense storms occurring mostly in September<br />
and October. The following two events, with contrasting time histories, are an excellent<br />
illustration of the different types of response of the catchment (table 2).<br />
Date Maximum rainfall Maximum runoff Peak Ratio<br />
(in mm) (in mm) discharge Peak discharge/<br />
24 h 1 h 24 h 1 h (m 3 /s) Runoff in 24 h<br />
13.09.68 159 88 57 21 15.5 15.5<br />
29.10.83 165 25 25 3,4 1.61 3.6<br />
Table 2 - Floods of 13/09/68 and 29/10/83<br />
32<br />
APPLICATION OF THE GRADEX METHOD<br />
The GRADEX method is applied with time steps of 1, 2, 4, 8, 12 and 24 hours,<br />
although these last times are much longer than the catchment's characteristic time.<br />
Figures 1 and 2 (p. 35) are examples of observed 4-hour rainfall and runoff.<br />
The plots show all events during which rainfall in excess of a given value was recorded.<br />
CATCHMENT RETENTION<br />
Figure 1 (p. 35) shows that the retention loss was between 70 and 100 mm in the<br />
three heaviest rainfall events, and between 55 mm and 100 mm in the three largest<br />
flood events. Statistical analysis as described later indicates that the "pivot point" for<br />
the GRADEX method should be taken as the 0.95 frequency (20-year recurrence<br />
interval, reduced GUMBEL variable, u = 2.97).<br />
Table 3 shows retention versus duration of rainfall.<br />
Duration 1 2 4 8 12 24<br />
(hours)<br />
Retention 30 43 57 76 86 98<br />
(mm)<br />
Table 3 - Retention for a 20-year recurrence interval for different durations of rainfall.