

JOURNAL
3twmGXuyn
3twmGXuyn

You also want an ePaper? Increase the reach of your titles
YUMPU automatically turns print PDFs into web optimized ePapers that Google loves.
QUALITY SCHOOL INTERACTIONS AND STUDENT WELL-BEING IN THE DRC<br />
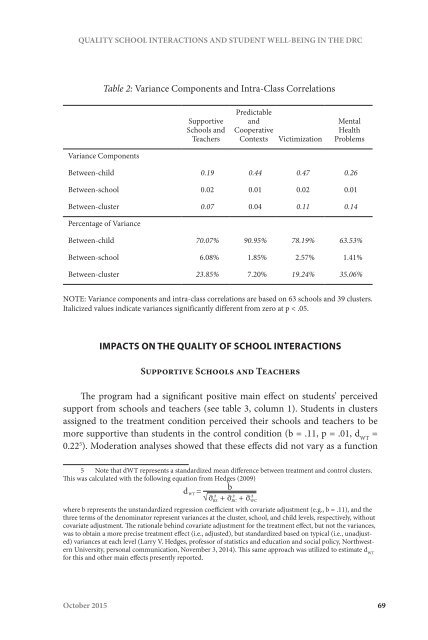
Table 2: Variance Components and Intra-Class Correlations<br />
Supportive<br />
Schools and<br />
Teachers<br />
Predictable<br />
and<br />
Cooperative<br />
Contexts<br />
Victimization<br />
Mental<br />
Health<br />
Problems<br />
Variance Components<br />
Between-child 0.19 0.44 0.47 0.26<br />
Between-school 0.02 0.01 0.02 0.01<br />
Between-cluster 0.07 0.04 0.11 0.14<br />
Percentage of Variance<br />
Between-child 70.07% 90.95% 78.19% 63.53%<br />
Between-school 6.08% 1.85% 2.57% 1.41%<br />
Between-cluster 23.85% 7.20% 19.24% 35.06%<br />
NOTE: Variance components and intra-class correlations are based on 63 schools and 39 clusters.<br />
Italicized values indicate variances significantly different from zero at p < .05.<br />
IMPACTS ON THE QUALITY OF SCHOOL INTERACTIONS<br />
Supportive Schools and Teachers<br />
The program had a significant positive main effect on students’ perceived<br />
support from schools and teachers (see table 3, column 1). Students in clusters<br />
assigned to the treatment condition perceived their schools and teachers to be<br />
more supportive than students in the control condition (b = .11, p = .01, d WT<br />
=<br />
0.22 5 ). Moderation analyses showed that these effects did not vary as a function<br />
5 Note that dWT represents a standardized mean difference between treatment and control clusters.<br />
This was calculated with the following equation from Hedges (2009)<br />
where b represents the unstandardized regression coefficient with covariate adjustment (e.g., b = .11), and the<br />
three terms of the denominator represent variances at the cluster, school, and child levels, respectively, without<br />
covariate adjustment. The rationale behind covariate adjustment for the treatment effect, but not the variances,<br />
was to obtain a more precise treatment effect (i.e., adjusted), but standardized based on typical (i.e., unadjusted)<br />
variances at each level (Larry V. Hedges, professor of statistics and education and social policy, Northwestern<br />
University, personal communication, November 3, 2014). This same approach was utilized to estimate d WT<br />
for this and other main effects presently reported.<br />
October 2015 69