Alevel_C1C2
Alevel_C1C2
Alevel_C1C2

Create successful ePaper yourself
Turn your PDF publications into a flip-book with our unique Google optimized e-Paper software.
5<br />
Exam-style assessment<br />
Graphs of functions<br />
1. Sketch the graph of the equation y = (x – 2)(2x + 1)(x + 3), taking suitable<br />
values of x. (2)<br />
Find the coordinates where the curve<br />
(a) intersects or touches the x-axis (3)<br />
(b) intersects the y-axis (1)<br />
2. Sketch the graph of the curve<br />
y = 2 +<br />
2<br />
x<br />
Show clearly on the graph the position of the asymptotes.<br />
On the same axes sketch the graph of the curve<br />
y = 2 −<br />
2<br />
x<br />
distinguishing between the two curves.<br />
Describe how the first curve is transformed into the second curve. (5)<br />
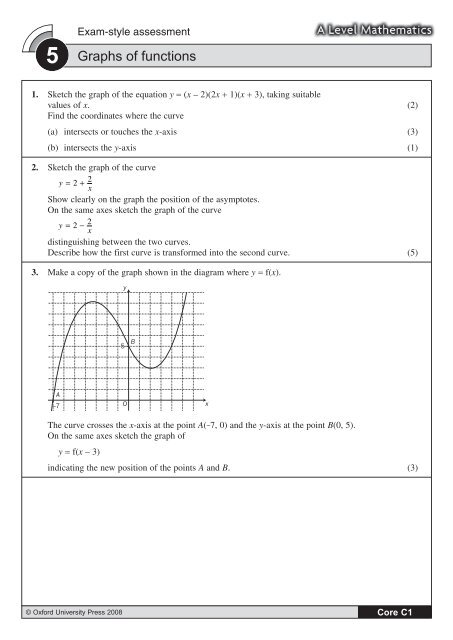
3. Make a copy of the graph shown in the diagram where y = f(x).<br />
y<br />
5<br />
B<br />
A<br />
–7<br />
O<br />
x<br />
The curve crosses the x-axis at the point A(-7, 0) and the y-axis at the point B(0, 5).<br />
On the same axes sketch the graph of<br />
y = f(x – 3)<br />
indicating the new position of the points A and B. (3)<br />
© Oxford University Press 2008<br />
Core C1