Alevel_C1C2
Alevel_C1C2
Alevel_C1C2
SHOW LESS

Create successful ePaper yourself
Turn your PDF publications into a flip-book with our unique Google optimized e-Paper software.
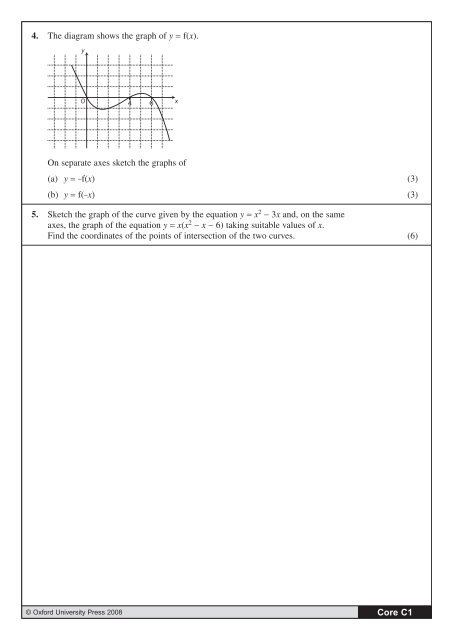
4. The diagram shows the graph of y = f(x).<br />
y<br />
O 4 6<br />
x<br />
On separate axes sketch the graphs of<br />
(a) y = -f(x) (3)<br />
(b) y = f(-x) (3)<br />
5. Sketch the graph of the curve given by the equation y = x 2 - 3x and, on the same<br />
axes, the graph of the equation y = x(x 2 - x - 6) taking suitable values of x.<br />
Find the coordinates of the points of intersection of the two curves. (6)<br />
© Oxford University Press 2008<br />
Core C1