Annual Report 2001 - Flughafen Wien
Annual Report 2001 - Flughafen Wien
Annual Report 2001 - Flughafen Wien

You also want an ePaper? Increase the reach of your titles
YUMPU automatically turns print PDFs into web optimized ePapers that Google loves.
Reply Card<br />
Yes, I want to receive<br />
information on <strong>Flughafen</strong><br />
<strong>Wien</strong> AG in the future.<br />
Please continue to send me<br />
Shareholders Letters and<br />
<strong>Annual</strong> <strong>Report</strong>s on a regular<br />
basis.<br />
I prefer to receive current<br />
information by e-mail.<br />
My e-mail address is:<br />
@<br />
Name/Company:<br />
Street:<br />
Postal Code/City:<br />
<strong>Flughafen</strong> <strong>Wien</strong><br />
Aktiengesellschaft<br />
P. O. Box 1<br />
A-1300 <strong>Wien</strong>-<strong>Flughafen</strong><br />
Telephone: +43-1-7007-0<br />
Telefax: +43-1-7007-23001<br />
http://www.viennaairport.com<br />
Data Registry Nr.: 008613<br />
Corporate Register Nr.: FN 42984 m<br />
Court of Registry:<br />
Provincial Court in Korneuburg<br />
Investor Relations:<br />
Robert Dusek<br />
Telephone: +43-1-7007-23126<br />
e-mail: investor-relations@viennaairport.com<br />
Communications Department:<br />
Dagmar Lang<br />
Telephone: +43-1-7007-22103<br />
e-mail: m@viennaairport.com<br />
Imprint<br />
Published by:<br />
<strong>Flughafen</strong> <strong>Wien</strong> Aktiengesellschaft<br />
Communications Department<br />
Consulting and Co-ordination:<br />
Mensalia Unternehmensberatung<br />
Design: Büro X<br />
Photos Colour: Günter Parth<br />
Photos b/w: Lukas Schaller<br />
Printed by: Holzhausen<br />
Translation: Donna Schiller-Margolis<br />
Please send me invitations<br />
to your airport tours and<br />
information events.<br />
Please remove my name<br />
from the shareholders file.<br />
I have no further interest in<br />
information on <strong>Flughafen</strong><br />
<strong>Wien</strong> AG.<br />
Postage<br />
paid by<br />
recipient<br />
To:<br />
<strong>Flughafen</strong> <strong>Wien</strong> AG<br />
Communications Dept.<br />
P.O. Box 1<br />
A-1300 <strong>Wien</strong>-<strong>Flughafen</strong><br />
The <strong>Annual</strong> <strong>Report</strong> <strong>2001</strong> of <strong>Flughafen</strong> <strong>Wien</strong><br />
is available for the first time in an online<br />
version in the Internet: Transparent, fast<br />
and, if desired, with individually selected<br />
information:<br />
www.viennaairport.com<br />
Disclaimer<br />
This annual report contains assumptions<br />
and forecasts, which were based on<br />
information available up to the copy<br />
deadline on 26 February 2002. If the<br />
premesis for these forecasts do not occur<br />
or risks indicated in the risk report do<br />
arise, actual results may vary from present<br />
forecasts. Although the greatest caution<br />
was exercised in preparing data, all<br />
information related to the future is<br />
provided without guarantee.<br />
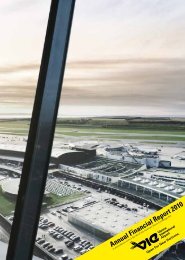
<strong>Flughafen</strong> <strong>Wien</strong> AG <strong>Annual</strong> <strong>Report</strong> <strong>2001</strong><br />
<strong>Annual</strong> <strong>Report</strong> <strong>2001</strong><br />
EUROPE´S BEST ADDRESS<br />
<strong>Flughafen</strong> <strong>Wien</strong> AG<br />
Key Data on the <strong>Flughafen</strong> <strong>Wien</strong> Group<br />
Industry Indicators <strong>2001</strong> Change 2000 Change 1999<br />
in % in %<br />
MTOW 1) (in mill. tonnes) 5.1 -4.3 5.3 6.6 5.0<br />
Passengers (in mill.) 11.9 -0.7 11.9 6.6 11.2<br />
Transfer passengers (in mill.) 3.8 12.2 3.4 9.3 3.1<br />
Flight movements 185,425 -0.6 186,469 8.6 171,682<br />
Cargo (air cargo and trucking; in tonnes) 159,525 -11.7 180,667 12.1 161,238<br />
IAS IAS<br />
Financial Indicators <strong>2001</strong> Change 2000 Change 1999<br />
(Amounts in € mill.) in % in %<br />
Total turnover 320.1 -2.2 327.4 4.7 312.6<br />
Thereof Airport 136.2 -0.9 137.4 4.0 132.1<br />
Thereof Handling 111.0 -5.9 117.9 8.9 108.3<br />
Thereof Non-Aviation 72.7 1.3 71.7 -0.4 72.0<br />
EBIT 85.2 -8.5 93.1 4.0 89.5<br />
EBIT-margin (in %) 2) 25.9 -6.9 27.9 -1.2 28.2<br />
EBITDA-margin (in %) 3) 38.5 -6.5 41.1 -1.3 41.7<br />
ROCE (in %) 4) 13.4 -9.5 14.8 5.1 14.0<br />
Net profit 66.3 -9.3 73.1 18.0 61.9<br />
Cash flow 98.3 -2.6 100.9 -13.9 117.2<br />
Equity 532.4 3.7 513.7 -10.1 571.2<br />
Capital expenditure 5) 61.3 114.9 28.5 -46.1 52.9<br />
Taxes on income 30.6 16.9 26.2 -22.8 33.9<br />
Stock Market Indicators <strong>2001</strong> Change 2000 Change 1999<br />
in % in %<br />
P/E Ratio (at year-end) 9.5 -18.0 11.6 -1.0 11.7<br />
Earnings per share 3.2 -9.2 3.5 18.0 3.0<br />
Dividend per share (incl. bonus) 1.9 -9.5 2.1 31.3 1.6<br />
Pay-out ratio (as % of net profit) 60.2 -0.2 60.3 11.2 54.2<br />
Market Cap (at year-end, in € mill.) 630.0 -25.6 846.3 16.8 724.7<br />
Market weighting (at year-end, in %) 3.0 0.0 3.0 31.1 2.3<br />
Employees 6) 2,626 -0.9 2,644 3.8 2,547<br />
Notes:<br />
1) MTOW: maximum take-off weight for aircraft<br />
2) EBIT-margin (earnings before interest and tax) = EBIT / Operating income<br />
3) EBITDA-margin (earnings before interest, tax, depreciation and amortisation) = EBIT + Depreciation / Operating income<br />
4) ROCE (return on capital employed after tax) = EBIT less allocated taxes / Average capital employed<br />
5) Tangible and intangible assets<br />
6) Weighted average number of employees as of 31.12. including apprentices and employees on official non paying leave (maternity, military service,<br />
etc.) and excluding the Management Board and managing directors.