

Pathways
Y0jEF
Y0jEF

You also want an ePaper? Increase the reach of your titles
YUMPU automatically turns print PDFs into web optimized ePapers that Google loves.
poverty head 17<br />
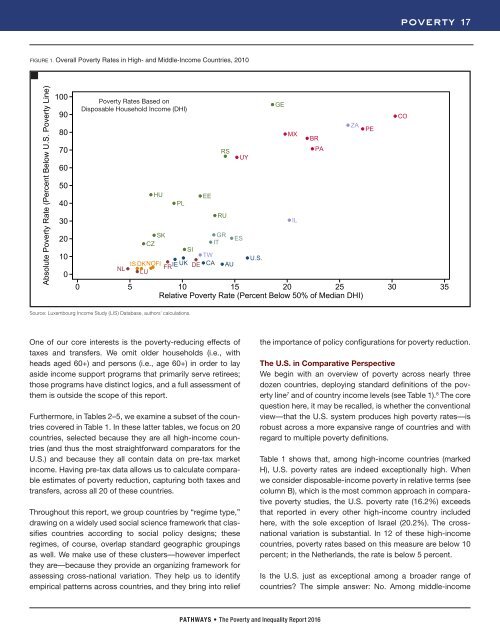
FIGURE 1. Overall Poverty Rates in High- and Middle-Income Countries, 2010<br />
Absolute Poverty Rate (Percent Below U.S. Poverty Line)<br />
100<br />
90<br />
80<br />
70<br />
60<br />
50<br />
40<br />
30<br />
20<br />
10<br />
0<br />
Poverty Rates Based on<br />
Disposable Household Income (DHI)<br />
HU<br />
PL<br />
EE<br />
RS<br />
RU<br />
SK<br />
GR<br />
ES<br />
CZ<br />
IT<br />
SI<br />
TW<br />
IS DKNOFI<br />
IE UK CA<br />
FR DE AU<br />
NL<br />
LU<br />
UY<br />
U.S.<br />
0 5 10 15 20 25 30 35<br />
Relative Poverty Rate (Percent Below 50% of Median DHI)<br />
GE<br />
MX<br />
IL<br />
BR<br />
PA<br />
ZA<br />
PE<br />
CO<br />
Source: Luxembourg Income Study (LIS) Database, authors’ calculations.<br />
One of our core interests is the poverty-reducing effects of<br />
taxes and transfers. We omit older households (i.e., with<br />
heads aged 60+) and persons (i.e., age 60+) in order to lay<br />
aside income support programs that primarily serve retirees;<br />
those programs have distinct logics, and a full assessment of<br />
them is outside the scope of this report.<br />
Furthermore, in Tables 2–5, we examine a subset of the countries<br />
covered in Table 1. In these latter tables, we focus on 20<br />
countries, selected because they are all high-income countries<br />
(and thus the most straightforward comparators for the<br />
U.S.) and because they all contain data on pre-tax market<br />
income. Having pre-tax data allows us to calculate comparable<br />
estimates of poverty reduction, capturing both taxes and<br />
transfers, across all 20 of these countries.<br />
Throughout this report, we group countries by “regime type,”<br />
drawing on a widely used social science framework that classifies<br />
countries according to social policy designs; these<br />
regimes, of course, overlap standard geographic groupings<br />
as well. We make use of these clusters—however imperfect<br />
they are—because they provide an organizing framework for<br />
assessing cross-national variation. They help us to identify<br />
empirical patterns across countries, and they bring into relief<br />
the importance of policy configurations for poverty reduction.<br />
The U.S. in Comparative Perspective<br />
We begin with an overview of poverty across nearly three<br />
dozen countries, deploying standard definitions of the poverty<br />
line 7 and of country income levels (see Table 1). 8 The core<br />
question here, it may be recalled, is whether the conventional<br />
view—that the U.S. system produces high poverty rates—is<br />
robust across a more expansive range of countries and with<br />
regard to multiple poverty definitions.<br />
Table 1 shows that, among high-income countries (marked<br />
H), U.S. poverty rates are indeed exceptionally high. When<br />
we consider disposable-income poverty in relative terms (see<br />
column B), which is the most common approach in comparative<br />
poverty studies, the U.S. poverty rate (16.2%) exceeds<br />
that reported in every other high-income country included<br />
here, with the sole exception of Israel (20.2%). The crossnational<br />
variation is substantial. In 12 of these high-income<br />
countries, poverty rates based on this measure are below 10<br />
percent; in the Netherlands, the rate is below 5 percent.<br />
Is the U.S. just as exceptional among a broader range of<br />
countries? The simple answer: No. Among middle-income<br />
PATHWAYS • The Poverty and Inequality Report 2016