

Pathways
Y0jEF
Y0jEF

Create successful ePaper yourself
Turn your PDF publications into a flip-book with our unique Google optimized e-Paper software.
40 wealth inequality<br />
approaches here. First, estates and inheritance tax returns<br />
provide information about wealth at death. 3 From these<br />
sources, one can infer how wealth is distributed across the<br />
living population, using the method known as the “mortality<br />
multiplier,” which was invented shortly before World War<br />
I by British and French economists. 4 Second, one can use<br />
individual income tax returns and capitalize the dividends,<br />
interest, rents, and other forms of capital income declared on<br />
such returns. Drawing on the detailed U.S. income tax data<br />
and Financial Accounts balance sheets, Emmanuel Saez and<br />
I recently used the capitalization technique to estimate the<br />
distribution of U.S. wealth annually since 1913, 5 as discussed<br />
below.<br />
Wealth inequality can also be studied using surveys. In the<br />
U.S., the Survey of Consumer Finances is available on a triennial<br />
basis from 1989 to 2013. In the euro area, the Household<br />
Finance and Consumption Survey (HFCS) provides harmonized<br />
micro-data on euro-area households’ wealth and<br />
consumption. The development of wealth surveys has led to<br />
a new wave of comparative studies that attempt to model<br />
the distribution of wealth from the bottom—including groups<br />
with negative net wealth—to the top. 6 The key advantage of<br />
surveys is that they include detailed socio-demographic data<br />
and wealth questionnaires that allow us to measure broad<br />
sets of assets for the entire population, including tax-exempt<br />
assets and assets at the bottom of the wealth distribution that<br />
are not covered in tax data.<br />
For all their promise, surveys also face two main limitations:<br />
(1) they are not available on a long-run basis, and (2) they raise<br />
serious difficulties regarding measurement at the top of the<br />
distribution. The wealthy are hard to reach in surveys (sampling<br />
error), and even those who respond may underestimate<br />
their wealth (non-sampling error). As a result, surveys are not<br />
representative of the richest individuals. In the Dutch wealth<br />
survey, for instance, there are only two individuals with more<br />
than €2 million in net wealth. 7 This is a serious issue because<br />
wealth is very concentrated (much more so than income). The<br />
richest 10 percent typically own between 60 percent and 80<br />
percent of aggregate wealth. Thus, to properly study crosscountry<br />
patterns in wealth inequality, it is critical to pay careful<br />
attention to those at the very top, and this leads us away from<br />
full reliance on surveys.<br />
However, tax sources also raise difficulties at the top, especially<br />
for the recent period, given the large rise of the wealth<br />
held in offshore tax havens such as Switzerland, the Cayman<br />
Islands, Singapore, and so on. 8 The wealthiest individuals<br />
have incentives to hide assets. Evidence from Norway suggests<br />
that offshore tax evasion at the very top can have a<br />
significant effect on inequality measures, even in countries<br />
with otherwise high-quality administrative data on wealth.<br />
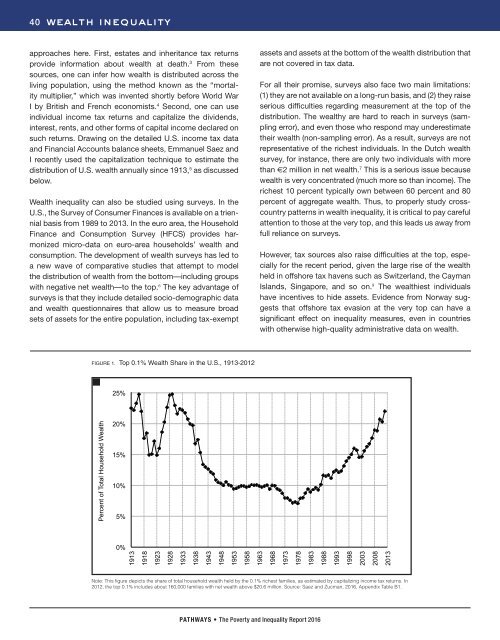
FIGURE 1. Top 0.1% Wealth Share in the U.S., 1913-2012<br />
25%<br />
Percent of Total Household Wealth<br />
20%<br />
15%<br />
10%<br />
5%<br />
0%<br />
1913<br />
1918<br />
1923<br />
1928<br />
1933<br />
1938<br />
1943<br />
1948<br />
1953<br />
1958<br />
1963<br />
1968<br />
1973<br />
1978<br />
1983<br />
1988<br />
1993<br />
1998<br />
2003<br />
2008<br />
2013<br />
Note: This figure depicts the share of total household wealth held by the 0.1% richest families, as estimated by capitalizing income tax returns. In<br />
2012, the top 0.1% includes about 160,000 families with net wealth above $20.6 million. Source: Saez and Zucman, 2016, Appendix Table B1.<br />
PATHWAYS • The Poverty and Inequality Report 2016