

Pathways
Y0jEF
Y0jEF

You also want an ePaper? Increase the reach of your titles
YUMPU automatically turns print PDFs into web optimized ePapers that Google loves.
esidential segregation 73<br />
a clear contrast to the market-driven solutions preferred in<br />
the U.S. 12 Our analysis of contemporary patterns of minority<br />
segregation provides an empirical baseline for future research<br />
that explicitly links minority segregation to other place-based<br />
inequalities, to patterns of concentrated poverty, and to the<br />
specific social and demographic processes (e.g., native- or<br />
white-flight, self-segregation, and housing discrimination)<br />
that are responsible for minority segregation and spatial<br />
inequality.<br />
An important unanswered question, of course, is whether<br />
current patterns of minority segregation—segregation of<br />
“the other”—will persist into the future. In the U.S., the law<br />
of the land applies equally to citizens and noncitizens, and<br />
the motivations to emigrate to the U.S. often involve the pursuit<br />
of the “American Dream.” For those who come legally,<br />
America provides the opportunity for immigrants to develop<br />
a new national identity and to move up the socioeconomic<br />
ladder. Whether this is true for immigrants in Europe is less<br />
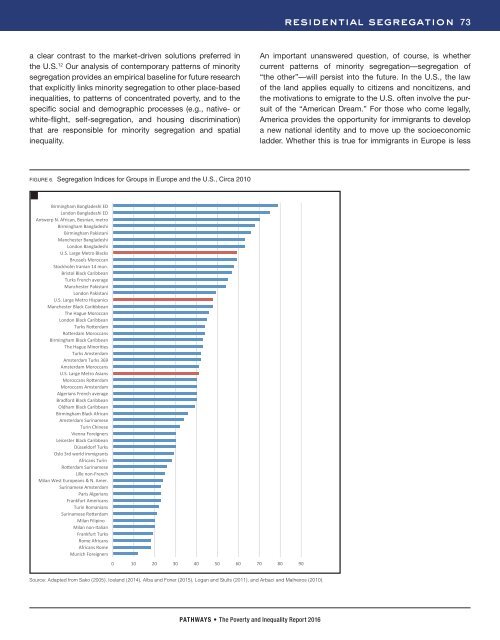
FIGURE 6. Segregation Indices for Groups in Europe and the U.S., Circa 2010<br />
Birmingham Bangladeshi ED <br />
London Bangladeshi ED <br />
Antwerp N. African, Bosnian, metro <br />
Birmingham Bangladeshi <br />
Birmingham Pakistani <br />
Manchester Bangladeshi <br />
London Bangladeshi <br />
U.S. Large Metro Blacks <br />
Brussels Moroccan <br />
Stockholm Iranian 14 mun. <br />
Bristol Black Caribbean <br />
Turks French average <br />
Manchester Pakistani <br />
London Pakistani <br />
U.S. Large Metro Hispanics <br />
Manchester Black Caribbbean <br />
The Hague Moroccan <br />
London Black Caribbean <br />
Turks RoEerdam <br />
RoEerdam Moroccans <br />
Birmingham Black Caribbean <br />
The Hague MinoriYes <br />
Turks Amsterdam <br />
Amsterdam Turks 369 <br />
Amsterdam Moroccans <br />
U.S. Large Metro Asians <br />
Moroccans RoEerdam <br />
Moroccans Amsterdam <br />
Algerians French average <br />
Bradford Black Caribbean <br />
Oldham Black Caribbean <br />
Birmingham Black African <br />
Amsterdam Surinamese <br />
Turin Chinese <br />
Vienna Foreigners <br />
Leicester Black Caribbean <br />
Düsseldorf Turks <br />
Oslo 3rd world immigrants <br />
Africans Turin <br />
RoEerdam Surinamese <br />
Lille non-‐French <br />
Milan West Europeans & N. Amer. <br />
Surinamese Amsterdam <br />
Paris Algerians <br />
Frankfurt Americans <br />
Turin Romanians <br />
Surinamese RoEerdam <br />
Milan Filipino <br />
Milan non-‐Italian <br />
Frankfurt Turks <br />
Rome Africans <br />
Africans Rome <br />
Munich Foreigners <br />
0 10 20 30 40 50 60 70 80 90 <br />
Source: Adapted from Sako (2005), Iceland (2014), Alba and Foner (2015), Logan and Stults (2011), and Arbaci and Malheiros (2010).<br />
PATHWAYS • The Poverty and Inequality Report 2016