

Pathways
Y0jEF
Y0jEF

You also want an ePaper? Increase the reach of your titles
YUMPU automatically turns print PDFs into web optimized ePapers that Google loves.
executive summary 5<br />
Conclusion #1: There is substantial cross-national<br />
variation in poverty and inequality.<br />
It may be unsurprising that countries differ substantially in<br />
their poverty, inequality, and labor market outcomes. But<br />
the extent of this variability is perhaps surprising. The simple<br />
conclusion: When the stork drops a newborn child into<br />
his or her new home, the location of that drop has profound<br />
implications for the amount of inequality the child will see<br />
and experience. The top percentile’s share of national wealth<br />
ranges, for example, from a low of 12.4 percent in Finland to<br />
a high of 41.8 percent in the U.S. (see Table 1). The rate of<br />
disposable income poverty, when measured in relative terms,<br />
ranges from a low of 7.0 percent in Norway to a high of 16.2<br />
percent in the U.S. The prime-age employment rate ranges<br />
from a low of 68.9 percent in Spain to a high of 84.8 percent<br />
in Germany. These results make it clear that, even among the<br />
relatively rich countries of Table 1, there are fundamental differences<br />
in the type of poverty and inequality regimes that<br />
have been established.<br />
This is not to gainsay the equally important point, as stressed<br />
in last year’s State of the Union report, that there is also much<br />
variability in poverty and inequality regimes within the U.S.<br />
If one compares, for example, the variability in top income<br />
shares across U.S. states with the variability across the welloff<br />
countries of North America and Continental Europe, one<br />
finds rather more variability within the U.S. 1<br />
Conclusion #2: The U.S. is an outlier.<br />
The first conclusion coming out of Table 1, then, is that one<br />
finds vastly different poverty and inequality profiles even<br />
among the well-off countries. We are of course especially<br />
interested in the position of the U.S. within this wide distribution<br />
of profiles. Is the U.S., as many have surmised, indeed an<br />
outlier among the well-off countries? Is it even an outlier when<br />
one considers countries that are less well-off?<br />
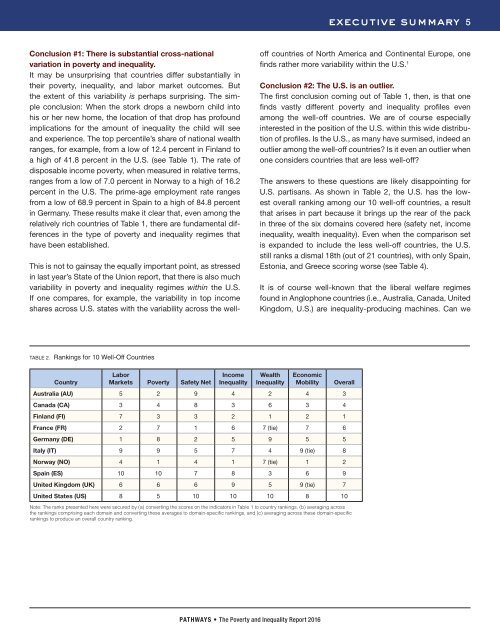
The answers to these questions are likely disappointing for<br />
U.S. partisans. As shown in Table 2, the U.S. has the lowest<br />
overall ranking among our 10 well-off countries, a result<br />
that arises in part because it brings up the rear of the pack<br />
in three of the six domains covered here (safety net, income<br />
inequality, wealth inequality). Even when the comparison set<br />
is expanded to include the less well-off countries, the U.S.<br />
still ranks a dismal 18th (out of 21 countries), with only Spain,<br />
Estonia, and Greece scoring worse (see Table 4).<br />
It is of course well-known that the liberal welfare regimes<br />
found in Anglophone countries (i.e., Australia, Canada, United<br />
Kingdom, U.S.) are inequality-producing machines. Can we<br />
TABLE 2. Rankings for 10 Well-Off Countries<br />
Country<br />
Labor<br />
Markets Poverty Safety Net<br />
Income<br />
Inequality<br />
Wealth<br />
Inequality<br />
Economic<br />
Mobility<br />
Australia (AU) 5 2 9 4 2 4 3<br />
Canada (CA) 3 4 8 3 6 3 4<br />
Finland (FI) 7 3 3 2 1 2 1<br />
France (FR) 2 7 1 6 7 (tie) 7 6<br />
Germany (DE) 1 8 2 5 9 5 5<br />
Italy (IT) 9 9 5 7 4 9 (tie) 8<br />
Norway (NO) 4 1 4 1 7 (tie) 1 2<br />
Spain (ES) 10 10 7 8 3 6 9<br />
United Kingdom (UK) 6 6 6 9 5 9 (tie) 7<br />
United States (US) 8 5 10 10 10 8 10<br />
Overall<br />
Note: The ranks presented here were secured by (a) converting the scores on the indicators in Table 1 to country rankings, (b) averaging across<br />
the rankings comprising each domain and converting these averages to domain-specific rankings, and (c) averaging across these domain-specific<br />
rankings to produce an overall country ranking.<br />
PATHWAYS • The Poverty and Inequality Report 2016