

Pathways
Y0jEF
Y0jEF

You also want an ePaper? Increase the reach of your titles
YUMPU automatically turns print PDFs into web optimized ePapers that Google loves.
poverty 19<br />
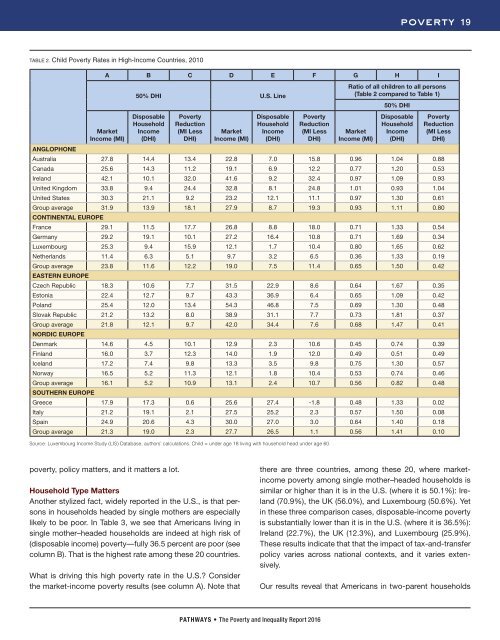
TABLE 2. Child Poverty Rates in High-Income Countries, 2010<br />
A B C D E F G H I<br />
50% DHI U.S. Line<br />
Ratio of all children to all persons<br />
(Table 2 compared to Table 1)<br />
50% DHI<br />
Market<br />
Income (MI)<br />
Disposable<br />
Household<br />
Income<br />
(DHI)<br />
Poverty<br />
Reduction<br />
(MI Less<br />
DHI)<br />
Market<br />
Income (MI)<br />
Disposable<br />
Household<br />
Income<br />
(DHI)<br />
Poverty<br />
Reduction<br />
(MI Less<br />
DHI)<br />
Market<br />
Income (MI)<br />
Disposable<br />
Household<br />
Income<br />
(DHI)<br />
Poverty<br />
Reduction<br />
(MI Less<br />
DHI)<br />
ANGLOPHONE<br />
Australia 27.8 14.4 13.4 22.8 7.0 15.8 0.96 1.04 0.88<br />
Canada 25.6 14.3 11.2 19.1 6.9 12.2 0.77 1.20 0.53<br />
Ireland 42.1 10.1 32.0 41.6 9.2 32.4 0.97 1.09 0.93<br />
United Kingdom 33.8 9.4 24.4 32.8 8.1 24.8 1.01 0.93 1.04<br />
United States 30.3 21.1 9.2 23.2 12.1 11.1 0.97 1.30 0.61<br />
Group average 31.9 13.9 18.1 27.9 8.7 19.3 0.93 1.11 0.80<br />
CONTINENTAL EUROPE<br />
France 29.1 11.5 17.7 26.8 8.8 18.0 0.71 1.33 0.54<br />
Germany 29.2 19.1 10.1 27.2 16.4 10.8 0.71 1.69 0.34<br />
Luxembourg 25.3 9.4 15.9 12.1 1.7 10.4 0.80 1.65 0.62<br />
Netherlands 11.4 6.3 5.1 9.7 3.2 6.5 0.36 1.33 0.19<br />
Group average 23.8 11.6 12.2 19.0 7.5 11.4 0.65 1.50 0.42<br />
EASTERN EUROPE<br />
Czech Republic 18.3 10.6 7.7 31.5 22.9 8.6 0.64 1.67 0.35<br />
Estonia 22.4 12.7 9.7 43.3 36.9 6.4 0.65 1.09 0.42<br />
Poland 25.4 12.0 13.4 54.3 46.8 7.5 0.69 1.30 0.48<br />
Slovak Republic 21.2 13.2 8.0 38.9 31.1 7.7 0.73 1.81 0.37<br />
Group average 21.8 12.1 9.7 42.0 34.4 7.6 0.68 1.47 0.41<br />
NORDIC EUROPE<br />
Denmark 14.6 4.5 10.1 12.9 2.3 10.6 0.45 0.74 0.39<br />
Finland 16.0 3.7 12.3 14.0 1.9 12.0 0.49 0.51 0.49<br />
Iceland 17.2 7.4 9.8 13.3 3.5 9.8 0.75 1.30 0.57<br />
Norway 16.5 5.2 11.3 12.1 1.8 10.4 0.53 0.74 0.46<br />
Group average 16.1 5.2 10.9 13.1 2.4 10.7 0.56 0.82 0.48<br />
SOUTHERN EUROPE<br />
Greece 17.9 17.3 0.6 25.6 27.4 -1.8 0.48 1.33 0.02<br />
Italy 21.2 19.1 2.1 27.5 25.2 2.3 0.57 1.50 0.08<br />
Spain 24.9 20.6 4.3 30.0 27.0 3.0 0.64 1.40 0.18<br />
Group average 21.3 19.0 2.3 27.7 26.5 1.1 0.56 1.41 0.10<br />
Source: Luxembourg Income Study (LIS) Database, authors’ calculations. Child = under age 18 living with household head under age 60.<br />
poverty, policy matters, and it matters a lot.<br />
Household Type Matters<br />
Another stylized fact, widely reported in the U.S., is that persons<br />
in households headed by single mothers are especially<br />
likely to be poor. In Table 3, we see that Americans living in<br />
single mother–headed households are indeed at high risk of<br />
(disposable income) poverty—fully 36.5 percent are poor (see<br />
column B). That is the highest rate among these 20 countries.<br />
What is driving this high poverty rate in the U.S.? Consider<br />
the market-income poverty results (see column A). Note that<br />
there are three countries, among these 20, where marketincome<br />
poverty among single mother–headed households is<br />
similar or higher than it is in the U.S. (where it is 50.1%): Ireland<br />
(70.9%), the UK (56.0%), and Luxembourg (50.6%). Yet<br />
in these three comparison cases, disposable-income poverty<br />
is substantially lower than it is in the U.S. (where it is 36.5%):<br />
Ireland (22.7%), the UK (12.3%), and Luxembourg (25.9%).<br />
These results indicate that that the impact of tax-and-transfer<br />
policy varies across national contexts, and it varies extensively.<br />
Our results reveal that Americans in two-parent households<br />
PATHWAYS • The Poverty and Inequality Report 2016