

Pathways
Y0jEF
Y0jEF

You also want an ePaper? Increase the reach of your titles
YUMPU automatically turns print PDFs into web optimized ePapers that Google loves.
30 safety net<br />
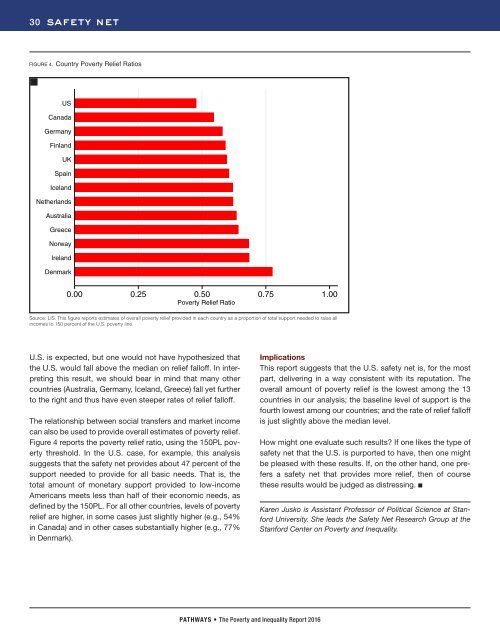
FIGURE 4. Country Poverty Relief Ratios<br />
US<br />
Canada<br />
Germany<br />
Finland<br />
UK<br />
Spain<br />
Iceland<br />
Netherlands<br />
Australia<br />
Greece<br />
Norway<br />
Ireland<br />
Denmark<br />
0.00 0.25 0.50 0.75 1.00<br />
Poverty Relief Ratio<br />
Source: LIS. This figure reports estimates of overall poverty relief provided in each country as a proportion of total support needed to raise all<br />
incomes to 150 percent of the U.S. poverty line.<br />
U.S. is expected, but one would not have hypothesized that<br />
the U.S. would fall above the median on relief falloff. In interpreting<br />
this result, we should bear in mind that many other<br />
countries (Australia, Germany, Iceland, Greece) fall yet further<br />
to the right and thus have even steeper rates of relief falloff.<br />
The relationship between social transfers and market income<br />
can also be used to provide overall estimates of poverty relief.<br />
Figure 4 reports the poverty relief ratio, using the 150PL poverty<br />
threshold. In the U.S. case, for example, this analysis<br />
suggests that the safety net provides about 47 percent of the<br />
support needed to provide for all basic needs. That is, the<br />
total amount of monetary support provided to low-income<br />
Americans meets less than half of their economic needs, as<br />
defined by the 150PL. For all other countries, levels of poverty<br />
relief are higher, in some cases just slightly higher (e.g., 54%<br />
in Canada) and in other cases substantially higher (e.g., 77%<br />
in Denmark).<br />
Implications<br />
This report suggests that the U.S. safety net is, for the most<br />
part, delivering in a way consistent with its reputation. The<br />
overall amount of poverty relief is the lowest among the 13<br />
countries in our analysis; the baseline level of support is the<br />
fourth lowest among our countries; and the rate of relief falloff<br />
is just slightly above the median level.<br />
How might one evaluate such results? If one likes the type of<br />
safety net that the U.S. is purported to have, then one might<br />
be pleased with these results. If, on the other hand, one prefers<br />
a safety net that provides more relief, then of course<br />
these results would be judged as distressing. ■<br />
Karen Jusko is Assistant Professor of Political Science at Stanford<br />
University. She leads the Safety Net Research Group at the<br />
Stanford Center on Poverty and Inequality.<br />
PATHWAYS • The Poverty and Inequality Report 2016