

Pathways
Y0jEF
Y0jEF

Create successful ePaper yourself
Turn your PDF publications into a flip-book with our unique Google optimized e-Paper software.
esidential segregation 69<br />
York State and Tennessee to lows of less than 10 in Arizona<br />
and Delaware. In Europe, the D’s range in size from 40.1 in<br />
Estonia to lows in the island countries of Iceland (1.2) and<br />
Ireland (4.8). Although there are large differences in the sizes<br />
of minority populations in Europe and the U.S., there nevertheless<br />
is rather remarkable similarity in macro-segregation<br />
across countries in Europe and states in the U.S.<br />
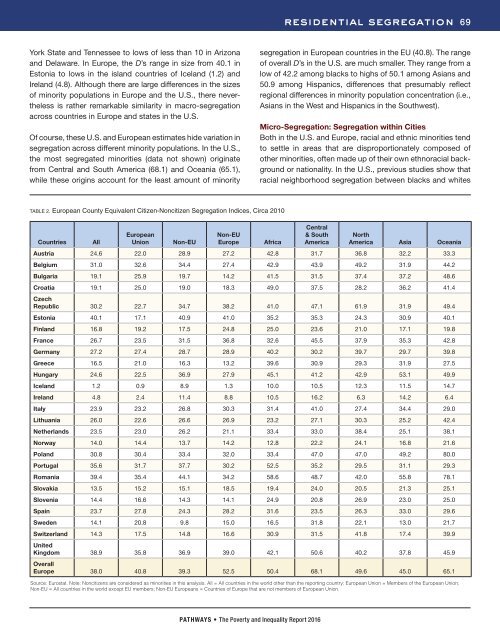
Of course, these U.S. and European estimates hide variation in<br />
segregation across different minority populations. In the U.S.,<br />
the most segregated minorities (data not shown) originate<br />
from Central and South America (68.1) and Oceania (65.1),<br />
while these origins account for the least amount of minority<br />
segregation in European countries in the EU (40.8). The range<br />
of overall D’s in the U.S. are much smaller. They range from a<br />
low of 42.2 among blacks to highs of 50.1 among Asians and<br />
50.9 among Hispanics, differences that presumably reflect<br />
regional differences in minority population concentration (i.e.,<br />
Asians in the West and Hispanics in the Southwest).<br />
Micro-Segregation: Segregation within Cities<br />
Both in the U.S. and Europe, racial and ethnic minorities tend<br />
to settle in areas that are disproportionately composed of<br />
other minorities, often made up of their own ethnoracial background<br />
or nationality. In the U.S., previous studies show that<br />
racial neighborhood segregation between blacks and whites<br />
TABLE 2. European County Equivalent Citizen-Noncitizen Segregation Indices, Circa 2010<br />
Countries<br />
All<br />
European<br />
Union<br />
Non-EU<br />
Non-EU<br />
Europe<br />
Africa<br />
Central<br />
& South<br />
America<br />
North<br />
America Asia Oceania<br />
Austria 24.6 22.0 28.9 27.2 42.8 31.7 36.8 32.2 33.3<br />
Belgium 31.0 32.6 34.4 27.4 42.9 43.9 49.2 31.9 44.2<br />
Bulgaria 19.1 25.9 19.7 14.2 41.5 31.5 37.4 37.2 48.6<br />
Croatia 19.1 25.0 19.0 18.3 49.0 37.5 28.2 36.2 41.4<br />
Czech<br />
Republic 30.2 22.7 34.7 38.2 41.0 47.1 61.9 31.9 49.4<br />
Estonia 40.1 17.1 40.9 41.0 35.2 35.3 24.3 30.9 40.1<br />
Finland 16.8 19.2 17.5 24.8 25.0 23.6 21.0 17.1 19.8<br />
France 26.7 23.5 31.5 36.8 32.6 45.5 37.9 35.3 42.8<br />
Germany 27.2 27.4 28.7 28.9 40.2 30.2 39.7 29.7 39.8<br />
Greece 16.5 21.0 16.3 13.2 39.6 30.9 29.3 31.9 27.5<br />
Hungary 24.6 22.5 36.9 27.9 45.1 41.2 42.9 53.1 49.9<br />
Iceland 1.2 0.9 8.9 1.3 10.0 10.5 12.3 11.5 14.7<br />
Ireland 4.8 2.4 11.4 8.8 10.5 16.2 6.3 14.2 6.4<br />
Italy 23.9 23.2 26.8 30.3 31.4 41.0 27.4 34.4 29.0<br />
Lithuania 26.0 22.6 26.6 26.9 23.2 27.1 30.3 25.2 42.4<br />
Netherlands 23.5 23.0 26.2 21.1 33.4 33.0 38.4 25.1 38.1<br />
Norway 14.0 14.4 13.7 14.2 12.8 22.2 24.1 16.8 21.6<br />
Poland 30.8 30.4 33.4 32.0 33.4 47.0 47.0 49.2 80.0<br />
Portugal 35.6 31.7 37.7 30.2 52.5 35.2 29.5 31.1 29.3<br />
Romania 39.4 35.4 44.1 34.2 58.6 48.7 42.0 55.8 78.1<br />
Slovakia 13.5 15.2 15.1 18.5 19.4 24.0 20.5 21.3 25.1<br />
Slovenia 14.4 16.6 14.3 14.1 24.9 20.8 26.9 23.0 25.0<br />
Spain 23.7 27.8 24.3 28.2 31.6 23.5 26.3 33.0 29.6<br />
Sweden 14.1 20.8 9.8 15.0 16.5 31.8 22.1 13.0 21.7<br />
Switzerland 14.3 17.5 14.8 16.6 30.9 31.5 41.8 17.4 39.9<br />
United<br />
Kingdom 38.9 35.8 36.9 39.0 42.1 50.6 40.2 37.8 45.9<br />
Overall<br />
Europe 38.0 40.8 39.3 52.5 50.4 68.1 49.6 45.0 65.1<br />
Source: Eurostat. Note: Noncitizens are considered as minorities in this analysis. All = All countries in the world other than the reporting country; European Union = Members of the European Union;<br />
Non-EU = All countries in the world except EU members; Non-EU Europeans = Countries of Europe that are not members of European Union.<br />
PATHWAYS • The Poverty and Inequality Report 2016