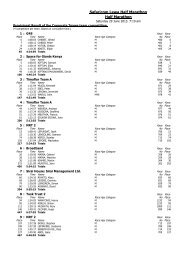
Sustainability Performance: At a glance (31 March 2012) - Safaricom
Sustainability Performance: At a glance (31 March 2012) - Safaricom
Sustainability Performance: At a glance (31 March 2012) - Safaricom

Create successful ePaper yourself
Turn your PDF publications into a flip-book with our unique Google optimized e-Paper software.
<strong>Sustainability</strong> <strong>Performance</strong>: <strong>At</strong> a <strong>glance</strong> (<strong>31</strong> <strong>March</strong> <strong>2012</strong>)<br />
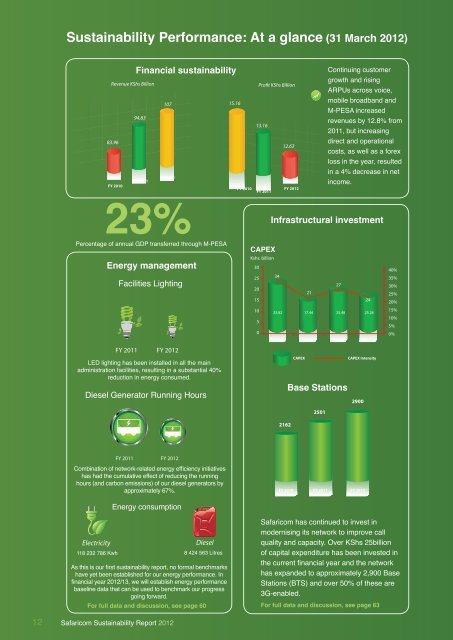
Financial sustainability<br />
Revenue KShs Billion Profit KShs Billion<br />
83.96<br />
FY 2010<br />
94.83<br />
FY 2011<br />
107<br />
FY <strong>2012</strong><br />
23%<br />
Percentage of annual GDP transferred through M-PESA<br />
Energy management<br />
Facilities Lighting<br />
FY 2011 FY <strong>2012</strong><br />
LED lighting has been installed in all the main<br />
administration facilities, resulting in a substantial 40%<br />
reduction in energy consumed.<br />
Diesel Generator Running Hours<br />
Infrastructural investment<br />
2162<br />
Base Stations<br />
FY 2011 FY <strong>2012</strong><br />
Combination of network-related energy efficiency initiatives<br />
has had the cumulative effect of reducing the running<br />
hours (and carbon emissions) of our diesel generators by<br />
approximately 67%. FY 2010 FY 2011 FY <strong>2012</strong><br />
Electricity<br />
118 232 786 Kwh<br />
Energy consumption<br />
Diesel<br />
8 424 563 Litres<br />
As this is our first sustainability report, no formal benchmarks<br />
have yet been established for our energy performance. In<br />
financial year <strong>2012</strong>/13, we will establish energy performance<br />
baseline data that can be used to benchmark our progress<br />
going forward.<br />
For full data and discussion, see page 60<br />
15.16<br />
FY 2010<br />
13.16<br />
FY 2011<br />
CAPEX<br />
Kshs. billion<br />
30<br />
25<br />
34<br />
20<br />
15<br />
10<br />
5<br />
0<br />
23.82<br />
12.63<br />
FY <strong>2012</strong><br />
21<br />
2501<br />
Continuing customer<br />
growth and rising<br />
ARPUs across voice,<br />
mobile broadband and<br />
M-PESA increased<br />
revenues by 12.8% from<br />
2011, but increasing<br />
direct and operational<br />
costs, as well as a forex<br />
loss in the year, resulted<br />
in a 4% decrease in net<br />
income.<br />
FY 2009 FY 2010 FY 2011 FY <strong>2012</strong><br />
2900<br />
<strong>Safaricom</strong> has continued to invest in<br />
modernising its network to improve call<br />
quality and capacity. Over KShs 25billion<br />
of capital expenditure has been invested in<br />
the current financial year and the network<br />
has expanded to approximately 2,900 Base<br />
Stations (BTS) and over 50% of these are<br />
3G-enabled.<br />
For full data and discussion, see page 63<br />
27<br />
24<br />
17.44 25.48 25.28<br />
CAPEX CAPEX Intensity<br />
40%<br />
35%<br />
30%<br />
25%<br />
20%<br />
15%<br />
10%<br />
5%<br />
0%<br />
Solar Energy ‘Diet Sites’<br />
2011<br />
2010<br />
The CCK has developed eight key<br />
performance indicators (KPIs) to assess the<br />
performance of mobile operators. <strong>Safaricom</strong>’s<br />
performance improved from being 37.5%<br />
compliant in 2010 to 75% by November 2011.<br />
For full data and discussion, see page 65<br />
Carbon emissions<br />
Hybrid/Renewable BTS<br />
Employee environment<br />
Perecentage of employees who<br />
have undergone OSH Training<br />
12 <strong>Safaricom</strong> <strong>Sustainability</strong> Report <strong>2012</strong> <strong>Safaricom</strong> <strong>Sustainability</strong> Report <strong>2012</strong> 13<br />
11<br />
Current<br />
For full data and discussion, see page 63<br />
14,900,000<br />
Total number of registered M-PESA customers<br />
Recognition<br />
• United Nations — Lifetime Contribution to the<br />
Millennium Development Goals<br />
• MIT Technology Review — Top 50 Most<br />
Innovative Companies <strong>2012</strong><br />
• Global Mobile International Awards <strong>2012</strong><br />
— Best Product, Initiative or Service for<br />
Underserved Segments<br />
For full data and discussion, see page 36<br />
Kenyans enjoying water security through the Maji na Uhai project<br />
<strong>31</strong><br />
FY <strong>2012</strong> Goal<br />
Communication Commission of<br />
Kenya (CCK) compliance<br />
80%<br />
70%<br />
60%<br />
50%<br />
40%<br />
30%<br />
20%<br />
10%<br />
Scope1: 25 462tCO e 2 Scope2: 44 795tCO e 2 Total: 70 257tCO e 2<br />
For full data and discussion, see page 98<br />
Current<br />
240<br />
1,136<br />
Digital villages successfully implemented<br />
1543 1158<br />
FY 2013 - 180 sites<br />
90%<br />
For full data and discussion, see page 86<br />
3,591<br />
Total number of permanent and temporary employees<br />
16,500 84%<br />
102<br />
Employees by gender<br />
Average supplier sustainability self-assessment score