We seal damp and protect
1o0Rrof
1o0Rrof

You also want an ePaper? Increase the reach of your titles
YUMPU automatically turns print PDFs into web optimized ePapers that Google loves.
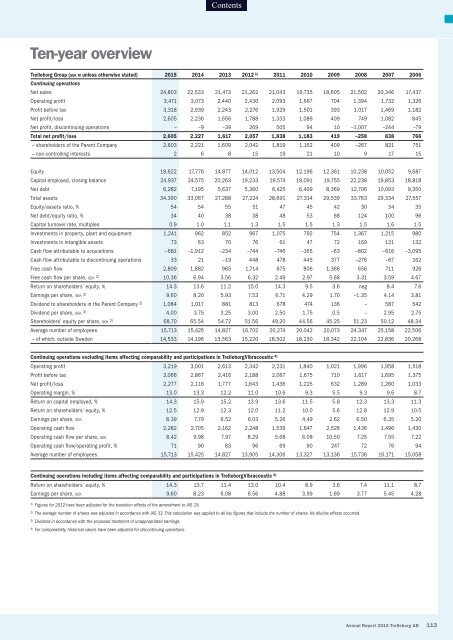
Ten-year overview<br />
1<br />
Trelleborg Group (sek m unless otherwise stated) 2015 2014 2013 2012 1) 2011 2010 2009 2008 2007 2006<br />
Continuing operations<br />
Net sales 24,803 22,533 21,473 21,262 21,043 19,735 18,605 21,502 20,346 17,437<br />
Operating profit 3,471 3,073 2,440 2,430 2,093 1,667 704 1,394 1,732 1,326<br />
Profit before tax 3,318 2,939 2,243 2,276 1,929 1,501 393 1,017 1,469 1,182<br />
Net profit/loss 2,605 2,236 1,656 1,788 1,333 1,089 409 749 1,082 845<br />
Net profit, discontinuing operations – –9 –39 269 505 94 10 –1,007 –244 –79<br />
Total net profit/loss 2,605 2,227 1,617 2,057 1,838 1,183 419 –258 838 766<br />
– shareholders of the Parent Company 2,603 2,221 1,609 2,042 1,819 1,162 409 –267 821 751<br />
– non-controlling interests 2 6 8 15 19 21 10 9 17 15<br />
Equity 18,622 17,776 14,877 14,012 13,504 12,196 12,361 10,238 10,052 9,687<br />
Capital employed, closing balance 24,937 24,575 20,263 19,233 19,574 18,091 19,755 22,238 19,853 18,818<br />
Net debt 6,282 7,195 5,637 5,360 6,425 6,409 8,369 12,706 10,093 9,350<br />
Total assets 34,390 33,067 27,288 27,224 28,691 27,314 29,539 33,763 29,334 27,557<br />
Equity/assets ratio, % 54 54 55 51 47 45 42 30 34 35<br />
Net debt/equity ratio, % 34 40 38 38 48 53 68 124 100 96<br />
Capital turnover rate, multiples 0.9 1.0 1.1 1.3 1.5 1.5 1.3 1.5 1.6 1.5<br />
Investments in property, plant <strong>and</strong> equipment 1,241 962 852 967 1,075 792 754 1,367 1,215 980<br />
Investments in intangible assets 73 63 70 76 61 47 72 159 121 132<br />
Cash flow attributable to acquisitions –681 –1,912 –234 –744 –746 –165 –63 –802 –616 –3,095<br />
Cash flow attributable to discontinuing operations 33 21 –19 448 478 445 377 –276 –67 162<br />
Free cash flow 2,809 1,882 965 1,714 675 806 1,366 656 711 926<br />
Free cash flow per share, sek 2) 10.36 6.94 3.56 6.32 2.49 2.97 5.68 3.31 3.59 4.67<br />
Return on shareholders’ equity, % 14.3 13.6 11.2 15.0 14.3 9.5 3.6 neg 8.4 7.6<br />
Earnings per share, sek 2) 9.60 8.20 5.93 7.53 6.71 4.29 1.70 –1.35 4.14 3.81<br />
Dividend to shareholders in the Parent Company 3) 1,084 1,017 881 813 678 474 136 – 587 542<br />
Dividend per share, sek 3) 4.00 3.75 3.25 3.00 2.50 1.75 0.5 – 2.95 2.75<br />
Shareholders’ equity per share, sek 2) 68.70 65.54 54.72 51.56 49.20 44.56 45.25 51.23 50.12 48.34<br />
Average number of employees 15,713 15,425 14,827 16,702 20,274 20,042 20,073 24,347 25,158 22,506<br />
– of which, outside Sweden 14,533 14,196 13,563 15,220 18,502 18,230 18,342 22,104 22,836 20,268<br />
Continuing operations excluding items affecting comparability <strong>and</strong> participations in TrelleborgVibracoustic 4)<br />
Operating profit 3,219 3,001 2,613 2,342 2,231 1,840 1,021 1,996 1,958 1,518<br />
Profit before tax 3,066 2,867 2,416 2,188 2,067 1,675 710 1,617 1,695 1,375<br />
Net profit/loss 2,277 2,116 1,777 1,643 1,436 1,225 632 1,289 1,260 1,033<br />
Operating margin, % 13.0 13.3 12.2 11.0 10.6 9.3 5.5 9.3 9.6 8.7<br />
Return on capital employed, % 14.3 15.9 15.2 13.9 13.6 11.5 5.8 12.3 13.3 11.3<br />
Return on shareholders’ equity, % 12.5 12.9 12.3 12.0 11.2 10.0 5.6 12.8 12.9 10.5<br />
Earnings per share, sek 8.39 7.79 6.52 6.03 5.26 4.49 2.62 6.50 6.35 5.20<br />
Operating cash flow 2,282 2,705 2,162 2,248 1,539 1,647 2,526 1,436 1,496 1,430<br />
Operating cash flow per share, sek 8.42 9.98 7.97 8.29 5.68 6.08 10.50 7.25 7.55 7.22<br />
Operating cash flow/operating profit, % 71 90 83 96 69 90 247 72 76 94<br />
Average number of employees 15,713 15,425 14,827 13,905 14,306 13,327 13,136 15,736 16,171 15,058<br />
Continuing operations including items affecting comparability <strong>and</strong> participations in TrelleborgVibracoustic 4)<br />
Return on shareholders’ equity, % 14.3 13.7 11.4 13.0 10.4 8.9 3.6 7.4 11.1 8.7<br />
Earnings per share, sek 9.60 8.23 6.08 6.56 4.88 3.99 1.69 3.77 5.45 4.28<br />
1) Figures for 2012 have been adjusted for the transition effects of the amendment to IAS 19.<br />
2) The average number of shares was adjusted in accordance with IAS 33. This calculation was applied to all key figures that include the number of shares. No dilutive effects occurred.<br />
3) Dividend in accordance with the proposed treatment of unappropriated earnings.<br />
4) For comparability, historical values have been adjusted for discontinuing operations.<br />
Annual Report 2015 Trelleborg AB 113