We seal damp and protect
1o0Rrof
1o0Rrof

Create successful ePaper yourself
Turn your PDF publications into a flip-book with our unique Google optimized e-Paper software.
NOTES – GROUP<br />
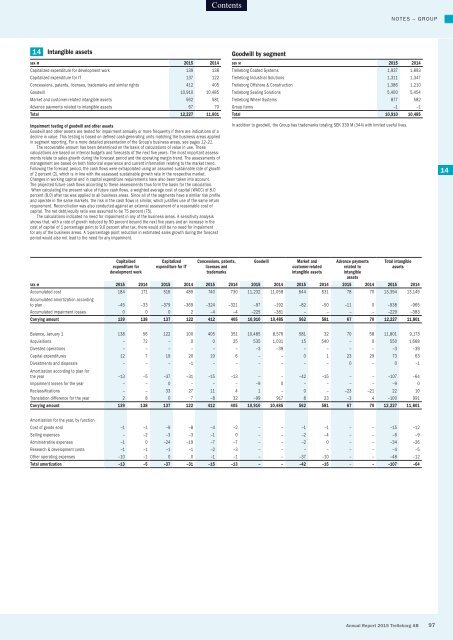
14 Intangible assets<br />
sek m 2015 2014<br />
Capitalized expenditure for development work 139 138<br />
Capitalized expenditure for IT 137 122<br />
Concessions, patents, licenses, trademarks <strong>and</strong> similar rights 412 405<br />
Goodwill 10,910 10,485<br />
Market <strong>and</strong> customer-related intangible assets 562 581<br />
Advance payments related to intangible assets 67 70<br />
Total 12,227 11,801<br />
Impairment testing of goodwill <strong>and</strong> other assets<br />
Goodwill <strong>and</strong> other assets are tested for impairment annually or more frequently if there are indications of a<br />
decline in value. This testing is based on defined cash-generating units matching the business areas applied<br />
in segment reporting. For a more detailed presentation of the Group’s business areas, see pages 12–21.<br />
The recoverable amount has been determined on the basis of calculations of value in use. These<br />
calculations are based on internal budgets <strong>and</strong> forecasts of the next five years. The most important assessments<br />
relate to sales growth during the forecast period <strong>and</strong> the operating margin trend. The assessments of<br />
management are based on both historical experience <strong>and</strong> current information relating to the market trend.<br />
Following the forecast period, the cash flows were extrapolated using an assumed sustainable rate of growth<br />
of 2 percent (2), which is in line with the assessed sustainable growth rate in the respective market.<br />
Changes in working capital <strong>and</strong> in capital expenditure requirements have also been taken into account.<br />
The projected future cash flows according to these assessments thus form the basis for the calculation.<br />
When calculating the present value of future cash flows, a weighted average cost of capital (WACC) of 8.0<br />
percent (8.0) after tax was applied to all business areas. Since all of the segments have a similar risk profile<br />
<strong>and</strong> operate in the same markets, the risk in the cash flows is similar, which justifies use of the same return<br />
requirement. Reconciliation was also conducted against an external assessment of a reasonable cost of<br />
capital. The net debt/equity ratio was assumed to be 75 percent (75).<br />
The calculations indicated no need for impairment in any of the business areas. A sensitivity analysis<br />
shows that, with a rate of growth reduced by 50 percent beyond the next five years <strong>and</strong> an increase in the<br />
cost of capital of 1 percentage point to 9.0 percent after tax, there would still be no need for impairment<br />
for any of the business areas. A 1-percentage point reduction in estimated sales growth during the forecast<br />
period would also not lead to the need for any impairment.<br />
Goodwill by segment<br />
sek m 2015 2014<br />
Trelleborg Coated Systems 1,937 1,893<br />
Trelleborg Industrial Solutions 1,311 1,347<br />
Trelleborg Offshore & Construction 1,386 1,210<br />
Trelleborg Sealing Solutions 5,400 5,454<br />
Trelleborg Wheel Systems 877 582<br />
Group items –1 –1<br />
Total 10,910 10,485<br />
In addition to goodwill, the Group has trademarks totaling SEK 339 M (344) with limited useful lives.<br />
14<br />
Capitalized<br />
expenditure for<br />
development work<br />
Capitalized<br />
expenditure for IT<br />
Concessions, patents,<br />
licenses <strong>and</strong><br />
trademarks<br />
Goodwill<br />
Market <strong>and</strong><br />
customer-related<br />
intangible assets<br />
Advance payments<br />
related to<br />
intangible<br />
assets<br />
Total intangible<br />
assets<br />
sek m 2015 2014 2015 2014 2015 2014 2015 2014 2015 2014 2015 2014 2015 2014<br />
Accumulated cost 184 171 516 489 740 730 11,232 11,058 644 631 78 70 13,394 13,149<br />
Accumulated amortization according<br />
to plan –45 –33 –379 –369 –324 –321 –97 –192 –82 –50 –11 0 –938 –965<br />
Accumulated impairment losses 0 0 0 2 –4 –4 –225 –381 – – – – –229 –383<br />
Carrying amount 139 138 137 122 412 405 10,910 10,485 562 581 67 70 12,227 11,801<br />
Balance, January 1 138 56 122 100 405 351 10,485 8,576 581 32 70 58 11,801 9,173<br />
Acquisitions – 72 – 0 0 25 535 1,031 15 540 – 0 550 1,668<br />
Divested operations – – – – – – –3 –39 – – – – –3 –39<br />
Capital expenditures 12 7 19 20 19 6 – – 0 1 23 29 73 63<br />
Divestments <strong>and</strong> disposals – – – –1 – – – – – – 0 – 0 –1<br />
Amortization according to plan for<br />
the year –13 –5 –37 –31 –15 –13 – – –42 –15 – – –107 –64<br />
Impairment losses for the year – – 0 – – – –9 0 – – – – –9 0<br />
Reclassifications – – 33 27 11 4 1 – 0 – –23 –21 22 10<br />
Translation difference for the year 2 8 0 7 –8 32 –99 917 8 23 –3 4 –100 991<br />
Carrying amount 139 138 137 122 412 405 10,910 10,485 562 581 67 70 12,227 11,801<br />
Amortization for the year, by function<br />
Cost of goods sold –1 –1 –9 –8 –4 –2 – – –1 –1 – – –15 –12<br />
Selling expenses – –2 –3 –3 –1 0 – – –2 –4 – – –6 –9<br />
Administrative expenses –1 0 –24 –19 –7 –7 – – –2 0 – – –34 –26<br />
Research & development costs –1 –1 –1 –1 –2 –3 – – – – – – –4 –5<br />
Other operating expenses –10 –1 0 0 –1 –1 – – –37 –10 – – –48 –12<br />
Total amortization –13 –5 –37 –31 –15 –13 – – –42 –15 – – –107 –64<br />
Annual Report 2015 Trelleborg AB 97