Template for HA Research Notes - ISRA VISION AG
Template for HA Research Notes - ISRA VISION AG
Template for HA Research Notes - ISRA VISION AG

You also want an ePaper? Increase the reach of your titles
YUMPU automatically turns print PDFs into web optimized ePapers that Google loves.
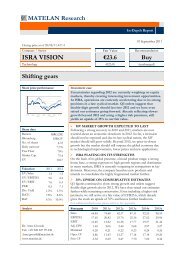
<strong>ISRA</strong> Vision<br />
Germany - High-tech Engineering<br />
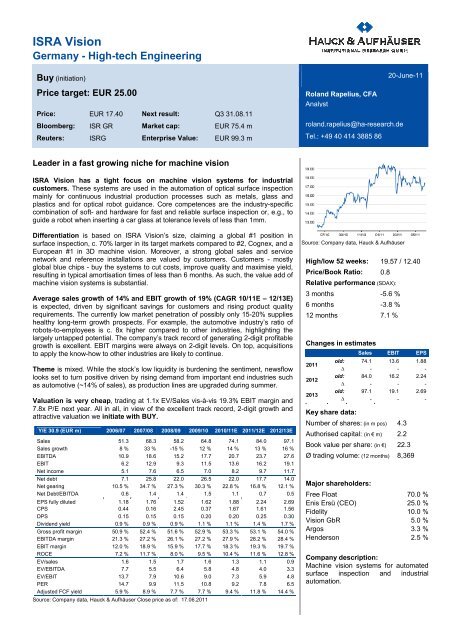
Buy (initiation)<br />
Price target: EUR 25.00<br />
Price: EUR 17.40 Next result: Q3 31.08.11<br />
Roland Rapelius, CFA<br />
Analyst<br />
Bloomberg: ISR GR Market cap: EUR 75.4 m roland.rapelius@ha-research.de<br />
Reuters: ISRG Enterprise Value: EUR 99.3 m<br />
Leader in a fast growing niche <strong>for</strong> machine vision<br />
<strong>ISRA</strong> Vision has a tight focus on machine vision systems <strong>for</strong> industrial<br />
customers. These systems are used in the automation of optical surface inspection<br />
mainly <strong>for</strong> continuous industrial production processes such as metals, glass and<br />
plastics and <strong>for</strong> optical robot guidance. Core competences are the industry-specific<br />
combination of soft- and hardware <strong>for</strong> fast and reliable surface inspection or, e.g., to<br />
guide a robot when inserting a car glass at tolerance levels of less than 1mm.<br />
Differentiation is based on <strong>ISRA</strong> Vision’s size, claiming a global #1 position in<br />
surface inspection, c. 70% larger in its target markets compared to #2, Cognex, and a<br />
European #1 in 3D machine vision. Moreover, a strong global sales and service<br />
network and reference installations are valued by customers. Customers - mostly<br />
global blue chips - buy the systems to cut costs, improve quality and maximise yield,<br />
resulting in typical amortisation times of less than 6 months. As such, the value add of<br />
machine vision systems is substantial.<br />
Average sales growth of 14% and EBIT growth of 19% (C<strong>AG</strong>R 10/11E – 12/13E)<br />
is expected, driven by significant savings <strong>for</strong> customers and rising product quality<br />
requirements. The currently low market penetration of possibly only 15-20% supplies<br />
healthy long-term growth prospects. For example, the automotive industry’s ratio of<br />
robots-to-employees is c. 8x higher compared to other industries, highlighting the<br />
largely untapped potential. The company’s track record of generating 2-digit profitable<br />
growth is excellent. EBIT margins were always on 2-digit levels. On top, acquisitions<br />
to apply the know-how to other industries are likely to continue.<br />
Theme is mixed. While the stock’s low liquidity is burdening the sentiment, newsflow<br />
looks set to turn positive driven by rising demand from important end industries such<br />
as automotive (~14% of sales), as production lines are upgraded during summer.<br />
Valuation is very cheap, trading at 1.1x EV/Sales vis-à-vis 19.3% EBIT margin and<br />
7.8x P/E next year. All in all, in view of the excellent track record, 2-digit growth and<br />
attractive valuation we initiate with BUY.<br />
Y/E 30.9 (EUR m) 2006/07 2007/08 2008/09 2009/10 2010/11E 2011/12E 2012/13E<br />
Sales 51.3 68.3 58.2 64.8 74.1 84.0 97.1<br />
Sales growth 8 % 33 % -15 % 12 % 14 % 13 % 16 %<br />
EBITDA 10.9 18.6 15.2 17.7 20.7 23.7 27.6<br />
EBIT 6.2 12.9 9.3 11.5 13.6 16.2 19.1<br />
Net income 5.1 7.6 6.5 7.0 8.2 9.7 11.7<br />
Net debt 7.1 25.8 22.0 26.5 22.0 17.7 14.0<br />
Net gearing 10.5 % 34.7 % 27.3 % 30.3 % 22.8 % 16.8 % 12.1 %<br />
Net Debt/EBITDA 0.6 1.4 1.4 1.5 1.1 0.7 0.5<br />
EPS fully diluted 1.18 1.76 1.52 1.62 1.88 2.24 2.69<br />
CPS 0.44 0.16 2.45 0.37 1.67 1.61 1.56<br />
DPS 0.15 0.15 0.15 0.20 0.20 0.25 0.30<br />
Dividend yield 0.9 % 0.9 % 0.9 % 1.1 % 1.1 % 1.4 % 1.7 %<br />
Gross profit margin 50.9 % 52.4 % 51.6 % 52.9 % 53.3 % 53.1 % 54.0 %<br />
EBITDA margin 21.3 % 27.2 % 26.1 % 27.2 % 27.9 % 28.2 % 28.4 %<br />
EBIT margin 12.0 % 18.9 % 15.9 % 17.7 % 18.3 % 19.3 % 19.7 %<br />
ROCE 7.2 % 11.7 % 8.0 % 9.5 % 10.4 % 11.6 % 12.8 %<br />
EV/sales 1.6 1.5 1.7 1.6 1.3 1.1 0.9<br />
EV/EBITDA 7.7 5.5 6.4 5.8 4.8 4.0 3.3<br />
EV/EBIT 13.7 7.9 10.6 9.0 7.3 5.9 4.8<br />
PER 14.7 9.9 11.5 10.8 9.2 7.8 6.5<br />
Adjusted FCF yield 5.9 % 8.9 % 7.7 % 7.7 % 9.4 % 11.8 % 14.4 %<br />
Source: Company data, Hauck & Aufhäuser Close price as of: 17.06.2011<br />
Tel.: +49 40 414 3885 86<br />
Source: Company data, Hauck & Aufhäuser<br />
20-June-11<br />
High/low 52 weeks: 19.57 / 12.40<br />
Price/Book Ratio: 0.8<br />
Relative per<strong>for</strong>mance (SDAX):<br />
3 months -5.6 %<br />
6 months -3.8 %<br />
12 months 7.1 %<br />
Changes in estimates<br />
2011<br />
2012<br />
2013<br />
Key share data:<br />
Sales EBIT EPS<br />
old: 74.1 13.6 1.88<br />
∆ - - -<br />
old: 84.0 16.2 2.24<br />
∆ - - -<br />
old: 97.1 19.1 2.69<br />
∆ - - -<br />
Number of shares: (in m pcs) 4.3<br />
Authorised capital: (in € m) 2.2<br />
Book value per share: (in €) 22.3<br />
Ø trading volume: (12 months) 8,369<br />
Major shareholders:<br />
Free Float 70.0 %<br />
Enis Ersü (CEO) 25.0 %<br />
Fidelity 10.0 %<br />
Vision GbR 5.0 %<br />
Argos 3.3 %<br />
Henderson 2.5 %<br />
Company description:<br />
Machine vision systems <strong>for</strong> automated<br />
surface inspection and industrial<br />
automation.
<strong>ISRA</strong> Vision<br />
Table of Contents<br />
Company background 3<br />
Investment case 4<br />
Competitive Quality 4<br />
Growth 6<br />
Valuation 12<br />
Theme 12<br />
ROCE Decomposition 15<br />
Valuation 19<br />
Company background 21<br />
Financials 26<br />
Contacts: Hauck&Aufhäuser Investment Banking 32<br />
2 Hauck & Aufhäuser Institutional <strong>Research</strong>
<strong>ISRA</strong> Vision<br />
Company background<br />
Products<br />
Industrial Automation Surface Vision Group<br />
Robot guidance systems <strong>for</strong> difficult tasks such<br />
as positioning, assembly (e.g. car glass or tires),<br />
handling or paint finishing.<br />
Visual Inspection of glass, foils, and plastics at<br />
high speeds or complex paint finished surfaces<br />
(such as car bodies, home appliances,<br />
components) - Control of objective criteria.<br />
Service accounts <strong>for</strong> c. 10% of sales. Average selling price per system € 150,000.<br />
Sales 2009/10 (€ m) 11.5 53.3 64.8<br />
Sales share 18% 82% 100%<br />
End markets<br />
Market positions<br />
Customers<br />
Competitors<br />
Raw Materials<br />
Suppliers<br />
Sales split (2009/10) by regions...<br />
NAFTA<br />
15%<br />
Rest of<br />
Europe<br />
24%<br />
Corporate sites<br />
metal, glass, plastic, paper / specialty paper, automotive, print, solar & photovoltaics, packaging,<br />
film & foils, nonwovens<br />
<strong>ISRA</strong> Vision claims a global #1 position in surface inspection systems <strong>for</strong> continuous production<br />
processes and a European #1 in 3D machine vision systems. By markets, <strong>ISRA</strong> Vision claims a #1<br />
position in glass, metal, plastics/nonwoven and automotive and a position among the top 3 in paper<br />
and solar glass.<br />
No single customer accounts <strong>for</strong> more than 2% of sales: Daimler, VW, Ford, GM, Nissan, Hyundai,<br />
Renault, Saint-Gobain, NSG Group, Pilkington, Asahi Glass, Schott, SolarWorld, WürthSolar,<br />
Q.Cells, Solarwatt, Epcos, aleo, First Solar, JFE, Nippon Steel, Bao Steel, posco, riva, Corus,<br />
ThyssenKrupp, ArcelorMittal, ChinaSteel, Constantia Packaging, MAN, UPM, M-real, Kimberly-<br />
Clark, StoraEnso, International Paper, manroland, Du Pont, Bayer<br />
Cognex, Perceptron, Advanced Vision Technology, Dr. Schenk, GP Solar, Vitronic, BST/Elexis,<br />
KLA Tencor, Orbotech, VAI/Voestalpine<br />
Asia<br />
Pacific,<br />
ROW<br />
38%<br />
Germany<br />
23%<br />
Personal computers, digital cameras, components<br />
Sony, various electronic component manufacturers<br />
Surface<br />
Vision<br />
82%<br />
... divisions...<br />
IndustrialAutomation<br />
18%<br />
...and customer industries<br />
Paper<br />
14%<br />
Print<br />
6%<br />
Plastics<br />
18%<br />
Subsidiaries and offices in over 15 countries in Europe, North and South America and Asia.<br />
EBIT 2009/10 (€ m) 1.9 9.6 11.5<br />
margin 16.3% 18.0% 17.7%<br />
ROCE n.a. n.a. 9.5%<br />
Source: company data, Hauck & Aufhäuser<br />
Metals<br />
25%<br />
Source: H&A estimates<br />
Automotive<br />
14%<br />
General<br />
Industries<br />
2%<br />
Glass<br />
21%<br />
3 Hauck & Aufhäuser Institutional <strong>Research</strong>
<strong>ISRA</strong> Vision<br />
Investment case<br />
Competitive Quality<br />
Founded in 1985 as a supplier of „Intelligent Systems Robotics and<br />
Automation”, <strong>ISRA</strong> Vision’s focus is on the niche of machine vision technology<br />
<strong>for</strong> automation of manufacturing and quality control. Machine vision systems<br />
typically consist of a camera, PC and software. In essence, products are<br />
computers that can “see” and thus help to solve customers’ problems.<br />
<strong>ISRA</strong> Vision’s focus within the market <strong>for</strong> machine vision technology is on the<br />
high-end i.e. application-specific standard products and complex generic<br />
standard products. It does not focus on the low-end machine vision market <strong>for</strong><br />
simple generic standard products such as sensors, basic hard- and software<br />
modules and components. As a result, the average selling price per <strong>ISRA</strong><br />
Vision system is € 150,000.<br />
<strong>ISRA</strong> Vision’s core competences of combing hard- and software know-how<br />
incorporating intelligent detection algorithms in order to produce fast and<br />
reliable surface quality data can be applied to various end markets. The fact<br />
that <strong>ISRA</strong> Vision owns this know-how is a major driver of growth and returns.<br />
There<strong>for</strong>e, the scalability of the business model – driving bottom line growth -<br />
looks high with respect to the transfer of existing technological competences.<br />
Moreover, important success factors are industry-specific references as well<br />
as a positive track record in a specific industry. These have been important<br />
rationales <strong>for</strong> <strong>ISRA</strong> Vision’s acquisition of Parsytec (metals and paper surface<br />
inspection systems) and Graphikon (wafer based solar cells and modules<br />
surface inspection systems).<br />
Differentiation is based on size, service network, reference installations and<br />
track record.<br />
• Competitors are a few larger and a large number of smaller local<br />
suppliers. Compared to the smaller competitors, differentiation is based on<br />
size which enables <strong>ISRA</strong> Vision to offer complete solutions (i.e. inspection<br />
systems at several relevant stages of an entire production process) and<br />
the respective industry-related know-how. Listed competitors include<br />
Cognex (US, 2x larger based on total revenues, however, in surface<br />
inspection which is <strong>ISRA</strong> Vision’s largest division, Cognex generated 15%<br />
of ttl sales in 2010 only, translating into c. € 31m. Compared to that, <strong>ISRA</strong><br />
Vision is c. 70% larger based on 2009/10 sales). Other listed peers include<br />
Perceptron (US) and AVT (Israel).<br />
• Customers, machine builders who integrate the machine vision<br />
functionality in a complete machine or end customers - i.e. mainly large,<br />
globally active blue chip industrial companies - value a one-stop shopping<br />
approach and a broad product portfolio, setting <strong>ISRA</strong> Vision apart from<br />
smaller players. They also value <strong>ISRA</strong> Vision’s global sales and service<br />
network as system uptime is critical. For example, a glass production line<br />
more or less runs non-stop, 24/7 <strong>for</strong> several years, setting high<br />
requirements <strong>for</strong> service and maintenance. A large sales and service<br />
network cannot be run economically by a smaller competitor.<br />
• Reference installations matter to customers in view of a systems’ long<br />
lifetime and high total system costs of several € m compared to only €<br />
150k <strong>for</strong> a machine vision system. These references are required to be<br />
specific with respect to a customer’s industry – such as metals, glass,<br />
automotive, plastic, solar glass, paper, print etc. – and with respect to a<br />
certain process step within this industry (e.g. pre-dryer, dryer, reeler etc. in<br />
a paper manufacturing process). <strong>ISRA</strong> Vision boasts a total of over 6,000<br />
reference installations and a blue-chip customer base.<br />
4 Hauck & Aufhäuser Institutional <strong>Research</strong>
<strong>ISRA</strong> Vision<br />
o In the metals industry, <strong>for</strong> example, Andritz Metals Division, a<br />
leading global suppliers of rolling mills and strip processing lines,<br />
believes that <strong>ISRA</strong> Vision (Parsytec) and Cognex are market<br />
leaders in visual surface inspection technology.<br />
o SMS Siemag, a major global supplier of metals production and<br />
processing equipment, values the ability of a supplier to deliver<br />
customised quality inspection systems, flexibility and a positive<br />
track record of delivering in time.<br />
o In the paper industry, <strong>ISRA</strong> Vision boasts a world unique and<br />
most complete portfolio of inspection systems at several stages of<br />
the production process, including wire & trim, pick-up, open draw,<br />
press-to-dryer, pre-dryer, dryer, size press and calendar and<br />
reeler.<br />
o In the glass industry, <strong>ISRA</strong> Vision claims a unique positioning<br />
due to its all-in-one camera design and unique high-speed LED<br />
technology combining several optical channels.<br />
o In the solar industry, supported by <strong>ISRA</strong> Vision’s recent<br />
acquisition of Graphikon in 2010, the company is able to offer fully<br />
automated inspection combined with 100% defect recognition.<br />
• <strong>ISRA</strong> Vision’s track record of generating profitable growth over the last<br />
decade at double-digit sales growth rates and always generating 2-digit<br />
EBIT margins as well as a sound balance sheet (54% equity ratio, 30%<br />
net gearing) matter to customers as it signals financial health and stability.<br />
In summary, these strengths have resulted in a global #1 market position in<br />
visual surface inspection technology mainly <strong>for</strong> continuous industrial<br />
manufacturing processes <strong>for</strong> metal, glass and plastics/nonwovens and a<br />
European #1 position in 3D vision systems, mainly supplied to the automotive<br />
industry. The company claims a top 3 position in the solar glass and a top 3-4<br />
position in the paper industry.<br />
High R&D supplies competitive defence versus smaller competitors.<br />
<strong>ISRA</strong> Vision’s size allows the company to spend high amounts on R&D (13%<br />
of 2010 sales) to support its technological expertise. These sums are unlikely<br />
to be matched by smaller competitors. Among the listed competitors, Cognex’<br />
R&D budgets are higher in absolute terms, however, the product mix and end<br />
market focus (mainly on semiconductor and electronics) is different compared<br />
to <strong>ISRA</strong> Vision and there<strong>for</strong>e limits direct comparisons.<br />
Peer group – R&D budgets<br />
R&D (€ m) % of sales employees<br />
in R&D<br />
% of total<br />
employees<br />
R&D (€ m) % of sales employees<br />
in R&D<br />
% of total<br />
employees<br />
end of<br />
fiscal year<br />
<strong>ISRA</strong> Vision 11.0 15.1% 76 18% 10.2 15.5% 73 20% 30.09.<br />
AVT 7.1 17.9% 60 29% 8.5 22.8% 75 33% 31.12.<br />
Cognex 23.5 11.4% 184 22% 22.1 17.7% 168 23% 31.12.<br />
Perceptron 5.2 14.0% 45 20% 5.7 13.0% 47 21% 30.06.<br />
Source: company data, Hauck & Aufhäuser<br />
2010 2009<br />
5 Hauck & Aufhäuser Institutional <strong>Research</strong>
<strong>ISRA</strong> Vision<br />
Growth<br />
Average sales growth of 14% (C<strong>AG</strong>R 2010/11E – 2012/13E)<br />
Potentially adressable market of € 3.2 bn, actual market size possibly<br />
well below € 1bn<br />
The potential size of the market <strong>for</strong> machine vision technology focused by <strong>ISRA</strong><br />
Vision is estimated at € 3.2bn sales per year. By application, more than half of<br />
the market is due to surface vision technology, followed by robot vision<br />
technology and quality vision systems. Based on the assumption that currently<br />
only 15% - 20% of the potentially adressable market is yet penetrated, the<br />
actual addressable market size is assumed between € 480m - € 640m sales per<br />
year.<br />
Machine Vision market focused by <strong>ISRA</strong> Vision - potential of € 3.2 bn p.a.<br />
Surface<br />
Vision<br />
56%<br />
Source: Company data; Hauck & Aufhäuser<br />
Robot Vision<br />
27%<br />
Quality Vision<br />
17%<br />
2-digit market growth<br />
Growth rates of machine vision technology vary by subsectors, but are typically<br />
assumed to be in the low 2-digit range, between c. 10% - 15% levels, driven by<br />
the substantial cost savings and quality improvements.<br />
VDMA expects 11% market growth this year, adding it could be exceeded<br />
The VDMA, the German association <strong>for</strong> engineering and plant engineering, is<br />
expecting that the market <strong>for</strong> industrial machine vision systems and<br />
components is set to grow by 11% yoy in 2011 in terms of revenues of suppliers<br />
located in Germany with customers located in Germany and abroad. The VDMA<br />
is adding that this is a conservative scenario.<br />
<strong>ISRA</strong> Vision’s growth is diversified by regions and customer industries<br />
During the economic crisis in 2008/09, <strong>ISRA</strong> Vision’s revenues declined 15%<br />
which is only one third compared to the German engineering sector decline of<br />
45% (VDMA). This is the result of a broad sales exposure to end markets and<br />
regions:<br />
• By regions, the company generates nearly half of the revenues in Europe,<br />
followed by Asia and NAFTA.<br />
6 Hauck & Aufhäuser Institutional <strong>Research</strong>
<strong>ISRA</strong> Vision<br />
<strong>ISRA</strong> Vision - Regional sales split (2009/10)<br />
NAFTA<br />
15%<br />
Rest of Europe<br />
24%<br />
Source: Company data; Hauck & Aufhäuser<br />
Asia Pacific,<br />
ROW<br />
38%<br />
Germany<br />
23%<br />
• By customer industry, growth is driven by several and often uncorrelated<br />
end markets including metals, glass, paper, print, plastics/nonwoven and<br />
automotive.<br />
<strong>ISRA</strong> Vision - Assumed sales split by industrial segement (2009/10)<br />
Metals<br />
25%<br />
Paper<br />
14%<br />
Print<br />
6%<br />
Source: Hauck & Aufhäuser estimates<br />
Automotive<br />
14% General<br />
Industries<br />
2%<br />
Plastics<br />
18%<br />
Glass<br />
21%<br />
Automotive industry’s demand to accelerate in calendar H2 2011<br />
The Automotive industry is one of <strong>ISRA</strong> Vision’s important end markets,<br />
accounting <strong>for</strong> c. 14% of 2009/10 group sales. During the Q2 2010/11<br />
conference call on May 31, management said that in the summer months, when<br />
production in the automotive industry is seasonally slow, the sales momentum<br />
is expected to pick up significantly as new manufacturing lines or upgrades are<br />
typically being installed during that period.<br />
Major order win from Automotive industry published on June 15, 2011<br />
<strong>ISRA</strong> Vision said it has finalized a new, long term framework agreement (2-digit<br />
€m volume) with a German premium automobile manufacturer <strong>for</strong> the supply of<br />
3D measurement systems in quality control of car body manufacturing.<br />
7 Hauck & Aufhäuser Institutional <strong>Research</strong>
<strong>ISRA</strong> Vision<br />
<strong>ISRA</strong> Vision –industry segment demand and positioning<br />
Customer<br />
Industry<br />
2010/11E Trend <strong>ISRA</strong> Vision - market position<br />
Metals #1, dominant market share<br />
Glass<br />
Plastics #1<br />
Automotive<br />
Paper<br />
#1, dominant market share, #1 in<br />
automotive glass<br />
#1, unique position with broad<br />
portfolio of 35 applications<br />
among top 3, #1 in specialty paper<br />
(treasury notes) with dominant<br />
share<br />
Print among top 3 or 4<br />
Source: company data, Hauck & Aufhäuser<br />
New applications such as pharma drive additional growth<br />
In pharmaceutical industry, new coding regulations with respect to packaging<br />
are driving the need <strong>for</strong> vision systems. It is only one example <strong>for</strong> growth driven<br />
by new applications <strong>for</strong> machine vision systems. Growth rates of up to 20% in<br />
this segment look plausible, offering room <strong>for</strong> additional growth.<br />
Sharply rising camera per<strong>for</strong>mance and pixel processing power enable<br />
faster inspection processes<br />
Additionally, technological advances in the field of cameras and PCs are driving<br />
growth. For example, camera pixel resolution has increased 6-fold and camera<br />
bandwidth 10-fold within the last four years. At the same time, computer graphic<br />
cards also became more powerful, increasing their pixel processing capacities<br />
10-fold, from 14,000 to 140,000 lines per second equivalent to a capacity of 640<br />
MByte per second. This enables substantially faster inspection processes and<br />
hence triggers new investments or upgrades. For example, in steel production,<br />
at a speed of 1,200 meter per minute (translating into 72 Km/h or 45 mph)<br />
defect sizes of 150-200 µm can be recognised. In plastics, a web inspection<br />
speed of up to 3,000 m/min and a resolution of up to 10 µm can be achieved.<br />
Underlying growth driving customers’ need to increase quality and cut<br />
costsM<br />
Automation in manufacturing helps customers, which are typically industrial<br />
engineering companies in the metals, glass, plastics, automotive, paper or print<br />
industries, to solve two key problems: (1) to cut costs and (2) increase the<br />
product quality by reducing the number of defects. As such, industrial<br />
automation helps the customers to sustain their competitive edge.<br />
8 Hauck & Aufhäuser Institutional <strong>Research</strong>
<strong>ISRA</strong> Vision<br />
Reasons to invest in automation and robots include<br />
• Cost reduction (wages, training, health costs, heating, lighting etc)<br />
• Improve product quality (accuracy and repeatability of tedious tasks)<br />
• Improve working environment quality <strong>for</strong> employees<br />
• Increase output<br />
• Increase flexibility in manufacturing<br />
• Increase yield and reduce waste<br />
• Increase safety standards<br />
• Facilitate access to qualified labour<br />
• Reduce working capital due to lower inventory and work in progress<br />
• Reduce requirements <strong>for</strong> space in manufacturing<br />
Mmoreover, machine vision systems produce quality data to maximise<br />
yieldM<br />
Machine vision systems generate quality data that customers are using to<br />
maximise revenues by pricing the finished products according to their quality<br />
level. That way, <strong>for</strong> example, a steel producer is able to identify different sheet<br />
steel qualities which can then be sold at different price levels to maximise the<br />
yield. For example, in automotive, lower steel quality grades can be sold to<br />
mass producers while higher qualities are sold to German premium brands.<br />
Mresulting in short payback periods <strong>for</strong> a new system<br />
The payback period <strong>for</strong> a machine vision systems as part of an automised<br />
production systems is typically below 6 months, according to the company. It is<br />
driven by substantial cost savings on labour, increased throughput and reduced<br />
waste, as well as quality improvements. Moreover, compared to the total costs<br />
of a manufacturing cell or a complete production system, the costs of a machine<br />
vision system account <strong>for</strong> typically only a fraction of total costs while the value<br />
add in the process is significant.<br />
Growth is supported by low market penetration levels<br />
The market <strong>for</strong> machine vision technology is underpenetrated as only c. 15-20%<br />
of the potential applications are using machine vision to date, according to the<br />
company. Other industry sources estimate that only 10% of the potentially<br />
addressable market <strong>for</strong> machine vision technology is yet penetrated, mainly<br />
because some sectors have easier tasks to per<strong>for</strong>m than others and certain<br />
industries including automotive and electronics were able to adopt automation<br />
technologies earlier than others. The ratio of robots-to-employees in the<br />
automotive industry is 8x higher compared to other industries, according<br />
to KUKA <strong>AG</strong>, highlighting the room <strong>for</strong> growth.<br />
Moreover, certain sectors such as the footwear and clothing industries which<br />
are using floppy materials that require sewing did not have access to<br />
appropriate automation technology in the past and there<strong>for</strong>e shifted production<br />
to low-cost regions.<br />
Positive track record of generating profitable growth<br />
<strong>ISRA</strong> Vision’s track record of generating profitable growth is excellent (15%<br />
C<strong>AG</strong>R sales 2001-2010, always generated 2-digit EBIT margins). The company<br />
generated 2-digit EBIT margins even during crisis years while the long-term<br />
average EBIT margin (arithmetic mean 1998/99 – 2009/10) is 15%, while<br />
average EBITDA margins stood at 23%.<br />
9 Hauck & Aufhäuser Institutional <strong>Research</strong>
<strong>ISRA</strong> Vision<br />
<strong>ISRA</strong> Vision - Impressive track record of generating profitable growth (€ m, %)<br />
120<br />
100<br />
80<br />
60<br />
40<br />
20<br />
0<br />
1997/98<br />
1998/99<br />
1999/00<br />
2000/01<br />
2001/02<br />
2002/03<br />
Source: Company data; Hauck & Aufhäuser<br />
2003/04<br />
2004/05<br />
EBIT growth of 19% (C<strong>AG</strong>R 11E-13E)<br />
2005/06<br />
2006/07<br />
2007/08<br />
2008/09<br />
2009/10<br />
Sales EBITDA EBITDA-to-sales<br />
2010/11E<br />
2011/12E<br />
2012/13E<br />
High gross margins are setting the stage <strong>for</strong> earnings growth<br />
High gross margins at levels of 54% supply the basis <strong>for</strong> operating leverage.<br />
The company’s operating cost base is relatively lean, mainly driven by SG&A<br />
and R&D costs. In the mid term, the following cost structure looks plausible:<br />
• Sales and marketing expenses are assumed to remain < 20% of sales as<br />
the distribution of the product is mainly done directly. General and<br />
administration at c. 5% of sales.<br />
• Total R&D costs are assumed at 14% - 15% of sales driven by the need to<br />
constantly invest into new product developments and innovations in view<br />
of the largely untapped market potential. This would be in line with the<br />
ratio which competitor Cognex is targeting of 10% - 15% of sales going<br />
<strong>for</strong>ward.<br />
• Depreciation and amortisation around c. 10% of sales (included in cost of<br />
sales)<br />
• A moderate financial result between 1% - 2% of sales driven by low net<br />
debt levels of € 22m per end of 2010/11E, expected to decline going<br />
<strong>for</strong>ward.<br />
• Resulting in mid-term target EBITDA margins to the tune of 30% and EBT<br />
margins of roughly 20%.<br />
35%<br />
30%<br />
25%<br />
20%<br />
15%<br />
10%<br />
5%<br />
0%<br />
10 Hauck & Aufhäuser Institutional <strong>Research</strong>
<strong>ISRA</strong> Vision<br />
<strong>ISRA</strong> Vision – division sales and EBIT split<br />
EUR m 2004/05 2005/06 2006/07 2007/08 2008/09 2009/10 2010/11E 2011/12E 2012/13E<br />
Divisional sales<br />
Industrial Automation 11.0 12.5 14.2 15.8 10.9 11.5 12.3 13.6 15.3<br />
Surface Vision 33.7 35.2 37.0 52.4 47.3 53.3 61.8 70.4 81.7<br />
TTL 44.7 47.7 51.3 68.3 58.2 64.8 74.1 84.0 97.1<br />
Divisional sales shares<br />
Industrial Automation 25% 26% 28% 23% 19% 18% 17% 16% 16%<br />
Surface Vision 75% 74% 72% 77% 81% 82% 83% 84% 84%<br />
TTL 100% 100% 100% 100% 100% 100% 100% 100% 100%<br />
Divisional sales growth<br />
Industrial Automation na 14% 14% 11% -31% 6% 7% 10% 13%<br />
Surface Vision na 4% 5% 42% -10% 13% 16% 14% 16%<br />
TTL na 7% 8% 33% -15% 12% 14% 13% 16%<br />
Source: Company data, Hauck&Aufhäuser<br />
EUR m 2004/05 2005/06 2006/07 2007/08 2008/09 2009/10 2010/11E 2011/12E 2012/13E<br />
Divisional EBIT<br />
Industrial Automation 2.0 2.5 2.2 3.0 1.3 1.9 2.3 2.6 3.0<br />
Surface Vision 6.3 7.3 3.9 9.9 7.9 9.6 11.3 13.6 16.2<br />
TTL 8.3 9.7 6.2 12.9 9.3 11.5 13.6 16.2 19.1<br />
Divisional EBIT margin<br />
Industrial Automation 18.1% 19.5% 15.8% 19.2% 12.3% 16.3% 18.4% 19.2% 19.3%<br />
Surface Vision 18.6% 20.7% 10.5% 18.9% 16.8% 18.0% 18.3% 19.3% 19.8%<br />
TTL 18.5% 20.4% 12.0% 18.9% 15.9% 17.7% 18.3% 19.3% 19.7%<br />
Source: Company data, Hauck&Aufhäuser<br />
11 Hauck & Aufhäuser Institutional <strong>Research</strong>
<strong>ISRA</strong> Vision<br />
Valuation<br />
• Adjusted FCFY points to a fair value between € 21.40 and € 27.60 per<br />
share.<br />
• DCF yields a fair value of € 26.00 per share.<br />
• A peer group comparison is not very meaningful. US competitor<br />
Cognex is c. 2x larger in terms of sales compared to <strong>ISRA</strong> Vision and has<br />
a different product mix which also includes key components and is much<br />
more focused on the electronics and semiconductor industry. As a result,<br />
margins are higher compared to <strong>ISRA</strong> Vision (of 26.1% EBIT margin in<br />
2010 vis-à-vis <strong>ISRA</strong> Vision 2009/10 EBIT margin of 17.7%). AVT’s and<br />
Perceptron’s earnings <strong>for</strong>ecasts, which are based on very few analyst<br />
estimates, suggest that both are going to generate artificially low profits in<br />
the coming two years following several years of operating losses in the<br />
recent past. <strong>ISRA</strong> Vision always generated 2-digit EBIT margins, even in<br />
crisis years, pointing to a higher competitive quality.<br />
• The price target of € 25 per share is based on adjusted FCFY half way<br />
between 2010/11E and 2011/12E.<br />
Theme<br />
• Managements’ plans to carry out further acquisitions looks set to draw<br />
attention to the stock. The main rationale is to gain market share and<br />
industry-specific expertise. Unless it is a major target, the deals are<br />
expected to be financed by additional debt rather than equity.<br />
• Company founder and CEO Enis Ersü is major shareholder. CEO Mr<br />
Ersü owns 25% of the shares, aligning his interests with that of other<br />
shareholders.<br />
• Guidance <strong>for</strong> the current year reiterated. 2010/11 sales are expected<br />
clearly be above € 70m, EBIT margin to remain at least stable. By<br />
2013/14, management is targeting a € 100m sales volume based on<br />
organic growth. Acquisitions would come on top.<br />
• Return to growth and higher margins. After sales troughed in Q4<br />
2008/09, the return to the growth path of 2-digit sales growth (+28% yoy,<br />
+15% yoy, +25% yoy) in the recent three quarters was stunning.<br />
12 Hauck & Aufhäuser Institutional <strong>Research</strong>
<strong>ISRA</strong> Vision<br />
<strong>ISRA</strong> Vision - Quarterly sales and gross margins<br />
25<br />
20<br />
15<br />
10<br />
5<br />
0<br />
Q1 '07/08<br />
Q2 '07/08<br />
Q3 '07/08<br />
Q4 '07/08<br />
Q1 '08/09<br />
Q2 '08/09<br />
Source: Company data, Hauck & Aufhäuser<br />
Q3 '08/09<br />
Q4 '08/09<br />
Q1 '09/10<br />
Q2 '09/10<br />
Q3 '09/10<br />
Q4 '09/10<br />
Sales (€ m, left scale) Gross margin (%)<br />
Q1 '10/11<br />
Q2 '10/11<br />
Adjusted <strong>for</strong> seasonality, the recovery becomes more apparent<br />
When factoring out seasonality by looking at four quarters moving average<br />
figures, the improving growth and margin development becomes apparent.<br />
<strong>ISRA</strong> Vision - Quarterly sales and gross margins (moving average)<br />
40%<br />
30%<br />
20%<br />
10%<br />
0%<br />
-10%<br />
-20%<br />
Q4<br />
'07/08<br />
Q1<br />
'08/09<br />
Q2<br />
'08/09<br />
Q3<br />
'08/09<br />
Source: Company data, Hauck & Aufhäuser<br />
Q4<br />
'08/09<br />
Q1<br />
'09/10<br />
Q2<br />
'09/10<br />
Q3<br />
'09/10<br />
Q4<br />
'09/10<br />
Q1<br />
'10/11<br />
Q2<br />
'10/11<br />
Sales growth (% yoy, 4Q MA, left scale) Gross margin (4Q MA, right scale)<br />
• Positive press statements of peers and customers. Recent press<br />
statements of automation industry players and customers point to high<br />
growth momentum in the sector.<br />
• Cognex, a competitor, on May 2, 2011, presented Q1 results and said<br />
it is expecting to report strong sequential growth on both the top and<br />
bottom line <strong>for</strong> the second quarter, based on the current level of<br />
bookings.<br />
56%<br />
55%<br />
54%<br />
53%<br />
52%<br />
51%<br />
50%<br />
49%<br />
48%<br />
47%<br />
55%<br />
54%<br />
54%<br />
53%<br />
53%<br />
52%<br />
52%<br />
51%<br />
51%<br />
50%<br />
13 Hauck & Aufhäuser Institutional <strong>Research</strong>
<strong>ISRA</strong> Vision<br />
• ThyssenKrupp, one of <strong>ISRA</strong> Vision’s customers in the metals<br />
segment, on May 23, 2011, said it is planning to invest € 300m in<br />
three of its German sites to modernize the hot rolled manufacturing<br />
equipment, saying it mainly focuses on the improvement of the quality<br />
of the steel product while the investments are not expected to increase<br />
the total annual output.<br />
• DuPont, a customer, said it will invest € 12m this year in its German<br />
sites, to improve the efficiency of internal logistics and to introduce<br />
further automised robotics.<br />
14 Hauck & Aufhäuser Institutional <strong>Research</strong>
<strong>ISRA</strong> Vision<br />
ROCE Decomposition<br />
Strong balance sheet<br />
<strong>ISRA</strong> Vision’s total assets of € 161m at the end of fiscal 2009/10 (30.9.2010)<br />
are mainly<br />
• Fixed assets (€ 84m, 52% of total assets), thereof<br />
o intangible assets of € 80.4m (50% of total asset), of which<br />
goodwill accounts <strong>for</strong> € 37m or 23% of total assets (mainly<br />
resulting from the acquisitions carried out in the past), internally<br />
produced and capitalised assets (€ 28m, 17% of total assets) and<br />
software and licenses (€ 15m, 9% of total assets).<br />
• Inventory and accounts receivable account <strong>for</strong> 38% of total assets.<br />
• Assets are financed to a large extent by equity (€ 88m, 54.4% of total<br />
assets) and<br />
• Bank debt (21%).<br />
• The equity ratio is 54% and 31% adjusted <strong>for</strong> goodwill.<br />
Balance sheet - Assets<br />
100%<br />
90%<br />
80%<br />
70%<br />
60%<br />
50%<br />
40%<br />
30%<br />
20%<br />
10%<br />
0%<br />
Source: company data, Hauck & Aufhäuser<br />
Other assets<br />
Fixed Assets<br />
Accounts<br />
Receivables<br />
Inventories<br />
Liquid Assets<br />
2009/10<br />
Balance sheet - Liabilities<br />
Source: company data, Hauck & Aufhäuser<br />
Solvency<br />
<strong>ISRA</strong> Vision’s solvency looks set to improve further, driven by the expected<br />
rising cash generation. Net debt / EBITDA looks set to decline in the<br />
<strong>for</strong>eseeable future to levels below 1x with interest cover at very com<strong>for</strong>table<br />
levels of 12.8x by 2011/12E.<br />
Solvency<br />
100%<br />
80%<br />
60%<br />
40%<br />
20%<br />
0%<br />
100%<br />
2006/07 2007/08 2008/09 2009/10 2010/11E 2011/12E 2012/13E<br />
Net gearing (%) Equity ratio (%) Net debt / EBITDA (x)<br />
Source: company data, Hauck & Aufhäuser<br />
90%<br />
80%<br />
70%<br />
60%<br />
50%<br />
40%<br />
30%<br />
20%<br />
10%<br />
0%<br />
4.0x<br />
3.0x<br />
2.0x<br />
1.0x<br />
0.0x<br />
Other liabilities<br />
Acct. payables<br />
Provisions<br />
Interest bearing<br />
liabilities<br />
Equity<br />
2009/10<br />
15 Hauck & Aufhäuser Institutional <strong>Research</strong>
<strong>ISRA</strong> Vision<br />
Capex and R&D<br />
The capex volume is expected to remain at a high level between 10% - 12% of<br />
sales going <strong>for</strong>ward, exceeding D&A. Reason: the value of <strong>ISRA</strong> Vision’s<br />
capital base is largely determined by the value of its product portfolio.<br />
Consequently, the company has invested considerably and continuously in the<br />
past, whereas property, plant and equipment are hardly required, accounting<br />
<strong>for</strong> 1.7% of total assets only. 2009/10 total capex of € 8.3m (vis-à-vis total D&A<br />
of € 6.2m) is mainly due to internally produced and capitalised assets of €<br />
7.9m and fixed asset investments of € 0.5m. Internally produced and<br />
capitalised assets are depreciated over the useful life of typically 6 years. A<br />
pronounced capex cycle is not expected. Maintenance capex is assumed to<br />
remain on relatively high levels as R&D is assumed to act as an innovator and<br />
develop new applications in what is a largely untapped market potential.<br />
R&D costs reported in the P&L under cost-of-sales accounting in 2009/10 of €<br />
8.3m (12.9% of sales) differ only slightly from the capitalised amount. Reason:<br />
reported R&D costs are resulting from total R&D costs of € 11.0m, plus<br />
depreciation of € 5.5m (added back), less capitalised R&D of € 7.9m, less €<br />
0.2m grants.<br />
Capex bar and Capex/depreciation<br />
20.0<br />
18.0<br />
16.0<br />
14.0<br />
12.0<br />
10.0<br />
8.0<br />
6.0<br />
4.0<br />
2.0<br />
0.0<br />
2006/07 2007/08 2008/09 2009/10 2010/11E 2011/12E 2012/13E<br />
Source: company data, Hauck & Aufhäuser<br />
Capex Capex / Depreciation (x)<br />
Cash conversion cycle<br />
Compared to its direct stock-listed peers and other players from the sector,<br />
<strong>ISRA</strong> Vision’s cash conversion cycle is longer, owing to relatively high<br />
inventory levels, high accounts receivable and higher than average accounts<br />
payable. To some extent, this is likely driven by the product mix as competitors<br />
such as Cognex or Basler are also selling components while <strong>ISRA</strong> Vision is<br />
focused almost entirely on selling complete systems which are following<br />
lumpier dynamics in terms of revenue recognition. That said, the company has<br />
recently hired a new finance manager to focus on working capital efficiency<br />
which should lower the cash conversion cycle.<br />
2.0x<br />
1.8x<br />
1.6x<br />
1.4x<br />
1.2x<br />
1.0x<br />
0.8x<br />
0.6x<br />
0.4x<br />
0.2x<br />
0.0x<br />
16 Hauck & Aufhäuser Institutional <strong>Research</strong>
<strong>ISRA</strong> Vision<br />
Cash flow analysis<br />
90%<br />
80%<br />
70%<br />
60%<br />
50%<br />
40%<br />
30%<br />
20%<br />
10%<br />
0%<br />
2006/07 2007/08 2008/09 2009/10 2010/11E 2011/12E 2012/13E<br />
w/c / sales (%) Cash conversion cycle (days)<br />
Source: company data, Hauck & Aufhäuser<br />
Operating efficiency<br />
Operating efficiency looks set to increase moderately going <strong>for</strong>ward, driven by<br />
rising capacity utilisation and increasing productivity in terms of sales per<br />
employee which is supported by 2-digit sales growth.<br />
Cost base and leverage<br />
100%<br />
80%<br />
60%<br />
40%<br />
20%<br />
0%<br />
2006/07 2007/08 2008/09 2009/10 2010/11E 2011/12E 2012/13E<br />
Opex / sales (%) Personnel costs / sales (%) Sales / Employee (€k)<br />
Source: company data, Hauck & Aufhäuser<br />
Capital employed turnover<br />
On the basis of <strong>ISRA</strong> Vision’s healthy average sales growth of 12% annually<br />
and declining working capital-to-sales ratio, sales growth looks set to exceed<br />
capital employed growth, resulting in rising capital turnover.<br />
400<br />
350<br />
300<br />
250<br />
200<br />
150<br />
100<br />
50<br />
0<br />
300.0<br />
250.0<br />
200.0<br />
150.0<br />
100.0<br />
50.0<br />
0.0<br />
17 Hauck & Aufhäuser Institutional <strong>Research</strong>
<strong>ISRA</strong> Vision<br />
Capital employed turnover and sales<br />
1.0<br />
0.9<br />
0.8<br />
0.7<br />
0.6<br />
0.5<br />
0.4<br />
0.3<br />
0.2<br />
0.1<br />
0.0<br />
2006/07 2007/08 2008/09 2009/10 2010/11E 2011/12E 2012/13E<br />
Capital turn (x) Sales (€m)<br />
Source: company data, Hauck & Aufhäuser<br />
Returns<br />
Driven by rising operating margins on the back of rising sales and operating<br />
leverage and a well controlled cost base, return on capital employed looks set<br />
to return to higher levels, clearly exceeding cost of capital going <strong>for</strong>ward.<br />
Hence, the company does create value.<br />
The degree of cyclicality of returns looks limited, supported by the broad based<br />
sales split by end market and by regions which are often uncorrelated.<br />
Returns look sustainable at levels above ROCE defended by efficient barriers<br />
to entry due to high R&D spending and <strong>ISRA</strong> Vision’s large global sales and<br />
service network which smaller competitors cannot run economically.<br />
Returns<br />
20%<br />
15%<br />
10%<br />
5%<br />
0%<br />
2006/07 2007/08 2008/09 2009/10 2010/11E 2011/12E 2012/13E<br />
ROCE WACC WACC pre tax<br />
Source: company data, Hauck & Aufhäuser<br />
120.0<br />
100.0<br />
80.0<br />
60.0<br />
40.0<br />
20.0<br />
0.0<br />
18 Hauck & Aufhäuser Institutional <strong>Research</strong>
<strong>ISRA</strong> Vision<br />
Valuation<br />
The valuation is a very attractive feature of the investment case. Our<br />
conservative scenario points to significant upside. We have applied the<br />
following valuation methodologies:<br />
• Multi-stage DCF model<br />
• Adjusted FCF<br />
A peer group comparison is not very meaningful as the listed peers are either<br />
much larger and have a different product mix (Cognex, machine vision<br />
systems as well as components) or smaller, not well covered by sell-side<br />
analysts and expected to be suffering from the crisis years (AVT, Perceptron).<br />
DCF yields a fair value of € 26 per share<br />
The terminal value accounts <strong>for</strong> 70% of the total present value based on a<br />
terminal year EBIT margin of 17% which seems realistic in view of the<br />
company’s track record. Long-term growth of 2.5% is slightly above average,<br />
reflecting the largely underpenetrated market <strong>for</strong> machine vision technology,<br />
expected to drive 2-digit market growth.<br />
DCF (EUR m)<br />
(except per share data and beta)<br />
NOPAT<br />
Depreciation<br />
Increase/decrease in working capital<br />
Increase/decrease in long-term provisions and accruals<br />
Capex<br />
Acquisitions<br />
Capital increase<br />
Cash flow<br />
Present value<br />
WACC<br />
2011E 2012E 2013E 2014E 2015E 2016E 2017E 2018E<br />
Terminal<br />
value<br />
8.8 10.5 12.4 13.7 14.8 15.9 17.1 18.4 17.0<br />
7.1 7.5 8.4 9.3 10.0 10.8 11.6 12.5 14.9<br />
-0.9 -2.7 -4.9 -6.6 -5.2 -5.6 -6.0 -6.4 -6.9<br />
0.0 0.0 0.0 0.0 0.0 0.0 0.0 0.0 0.0<br />
-9.0 -9.3 -10.4 -11.5 -12.1 -12.5 -13.2 -13.9 -14.9<br />
0.0 0.0 0.0 0.0 0.0 0.0 0.0 0.0 0.0<br />
0.0 0.0 0.0 0.0 0.0 0.0 0.0 0.0 0.0<br />
5.9 6.0 5.6 5.1 7.5 8.6 9.5 10.5 10.1<br />
5.7 5.4 4.7 3.9 5.4 5.6 5.8 5.9 97.6<br />
6.8% 7.0% 7.2% 7.3% 7.6% 8.0% 8.0% 8.0% 8.0%<br />
DCF per share derived from DCF avg. growth and earnings assumptions<br />
Total present value 140 Short term growth (2010-2013) 14.4%<br />
thereof terminal value 70% Medium term growth (2013 - 2017) 8.2%<br />
Net debt (net cash) at start of year 26 Long term growth (2017 - infinity) 2.5%<br />
Financial assets 1 Terminal year EBIT margin 17.0%<br />
Pension provisions and off balance sheet debt 2<br />
Equity value 113 WACC derived from<br />
No. of shares outstanding<br />
4.3<br />
Cost of borrowings be<strong>for</strong>e taxes 4.1%<br />
Discounted cash flow per share 26.0 Tax rate 35.0%<br />
upside/(downside) 50% Cost of borrowings after taxes 2.7%<br />
Required return on invested capital 8.0%<br />
Risk premium 5.0%<br />
Risk-free rate 3.0%<br />
Share price 17.40 Beta 1.0<br />
Sensitivity analysis DCF Sensitivity analysis DCF<br />
WACC<br />
Long term growth EBIT margin terminal year<br />
26.0 0.5% 1.5% 2.5% 3.5% 4.5% 26.0 15.0% 16.0% 17.0% 18.0% 19.0%<br />
10.0% 14.5 15.9 17.6 20.0 23.1 10.0% 14.8 16.2 17.6 19.0 20.4<br />
9.0% 16.7 18.6 21.1 24.5 29.4 9.0% 17.6 19.4 21.1 22.9 24.6<br />
8.0% 19.7 22.4 26.0 31.3 39.6 8.0% 21.6 23.8 26.0 28.3 30.5<br />
WACC<br />
7.0% 23.7 27.7 33.3 42.2 58.2 7.0% 27.4 30.4 33.3 36.3 39.2<br />
6.0% 29.4 35.5 45.0 62.2 102.2 6.0% 36.8 40.9 45.0 49.1 53.2<br />
19 Hauck & Aufhäuser Institutional <strong>Research</strong>
<strong>ISRA</strong> Vision<br />
Adjusted FCF points to a fair value of € 25.00 per share<br />
Smaller companies rarely bear sufficient resemblance to peers in terms of<br />
geographical exposure, size or competitive strength and long-term returns<br />
often are flawed by the lack of sufficient visibility. There<strong>for</strong>e, an Adjusted Free<br />
Cash Flow analysis (Adjusted FCF) has additionally been conducted.<br />
The main driver of this model is the level of return available to a controlling<br />
investor, influenced by the cost of that investors’ capital (opportunity costs)<br />
and the purchase price –the enterprise value of the company.<br />
Here, the adjusted FCF yield is used as a proxy <strong>for</strong> the required return and is<br />
defined as EBITDA less minority interest, taxes and investments required to<br />
maintain existing assets (maintenance capex). Simply put, the model assumes<br />
that investors require companies to generate a minimum return on the<br />
investor’s purchase price.<br />
The fair value based on adjusted FCF in 2011/12E of € 27.60 is significantly<br />
higher compared to the fair value based on 2010/11E estimates, driven by<br />
earnings growth coupled with reduced net debt, lowering the EV. The price<br />
target is derived by valuing the stock half-way between 2010/11E and<br />
2011/12E, which points to a fair value of € 25.00 per share.<br />
FCF yield, year end Sept. 30 2010/11E 2011/12E 2012/13E<br />
EBITDA 20.7 23.7 27.6<br />
- Maintenance capex 7.1 7.5 8.4<br />
- Minorities 0.0 0.0 0.0<br />
- tax expenses 4.4 5.2 6.3<br />
= Adjusted Free Cash Flow 9.2 11.0 12.9<br />
Actual Market Cap 75.4 75.4 75.4<br />
+ Net debt (cash) 22.0 17.7 14.0<br />
+ Pension provisions 1.9 1.9 1.9<br />
+ Off balance sheet financing 0.0 0.0 0.0<br />
+ Adjustments prepayments 0.0 0.0 0.0<br />
- Financial assets -1.2 -1.2 -1.2<br />
- Dividend payment -0.9 -0.9 -1.1<br />
EV Reconciliations 21.9 17.6 13.6<br />
= Actual EV' 97.3 93.0 89.1<br />
Adjusted Free Cash Flow yield 9.4% 11.8% 14.4%<br />
Sales 74.1 84.0 97.1<br />
Actual EV/sales 1.3x 1.1x 0.9x<br />
Hurdle rate 8.0% 8.0% 8.0%<br />
FCF margin 12.4% 13.1% 13.3%<br />
Fair EV/sales 1.5x 1.6x 1.7x<br />
Fair EV 114.8 137.1 160.8<br />
- EV Reconciliations 21.9 17.6 13.6<br />
Fair Market Cap 93.0 119.6 147.2<br />
No. of shares (million) 4.3 4.3 4.3<br />
Fair value per share 21.4 27.6 34.0<br />
Premium (-) / discount (+) in % 23.2% 58.5% 95.1%<br />
Source: Hauck & Aufhäuser<br />
20 Hauck & Aufhäuser Institutional <strong>Research</strong>
<strong>ISRA</strong> Vision<br />
Company background<br />
Business model<br />
Whenever the limits of human visual perception are surpassed, machine vision<br />
technology is used to inspect welds, surfaces, printed pattern, folded carton,<br />
identify workpieces, guide robots or check completeness. Intelligent systems<br />
are able to learn recurring defects and allow <strong>for</strong> a systematic rectification,<br />
resulting in improved up-time.<br />
Also, defective parts are not passed on to subsequent manufacturing stages,<br />
thus enabling a 100% quality target in a cost effective way. <strong>ISRA</strong> Vision’s core<br />
competences (called BrainWARE ®) are due to the combination of soft- and<br />
hardware, incorporating industry-specific process know-how, algorithms to<br />
process vision data and an optimal system design to produce quality data in a<br />
reliable and fast way.<br />
<strong>ISRA</strong> Vision <strong>AG</strong> provides systems <strong>for</strong> industrial image processing using<br />
application-specific modular standard software solutions <strong>for</strong> surface inspection,<br />
robot guidance, and quality control applications, which are developed,<br />
produced and marketed by the company. The application specific machine<br />
vision systems are focusing on:<br />
• Automation of quality control<br />
• Automation of production<br />
• Yield enhancing production decision intelligence<br />
Reporting divisions<br />
<strong>ISRA</strong> Vision operates in two divisions:<br />
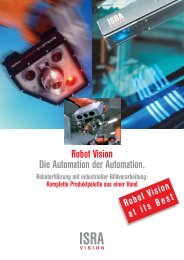
• Surface Vision Division (82% of 2009/10 sales): optical quality<br />
inspection systems mainly <strong>for</strong> sheet products such as flat glass, solar,<br />
display glass, paper, plastic, nonwoven and metal. Surface Vision focuses<br />
primarily on surface inspection technology mainly <strong>for</strong> web materials like<br />
flat glass, solar glass and display glass, foil, plastics, print, metal, paper<br />
and others. These materials are checked <strong>for</strong> defects during the production<br />
process.<br />
Surface Vision – optical in-line print inspection and documentation<br />
Source: company data<br />
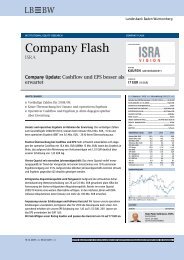
• Industrial Automation Division (18% of 2009/10 sales): Robot vision<br />
systems (2D or 3D) mainly supplied to the automotive, engineering,<br />
automation and general industry. For example, these systems enable a<br />
robot to insert a car windshield glass at a tolerance level of less than 1mm<br />
or to mount a wheel without scratching the car body. The Industrial<br />
Automation division focuses on the automotive and general industries.<br />
21 Hauck & Aufhäuser Institutional <strong>Research</strong>
<strong>ISRA</strong> Vision<br />
Primarily, these are the automobile industry, machine tool manufacturers,<br />
plant and system manufacturers and the original equipment manufacturer<br />
(OEM) markets. Robot Vision and Quality Vision products are mainly<br />
offered in this segment, but also other technologies like surface inspection<br />
is offered.<br />
Industrial Automation – automotive wheel assembly<br />
Source: company data<br />
Company history<br />
Foundation of <strong>ISRA</strong><br />
Systemtechnik GmbH<br />
at the Technical<br />
University of the City<br />
of Darmstadt,<br />
Germany.<br />
2001-<br />
1985 1988 1996 1997 2000<br />
2007 2008<br />
2006-<br />
The first system <strong>for</strong><br />
automotive<br />
development<br />
obtained the Hessian<br />
Innovation Award.<br />
<strong>ISRA</strong> supervised<br />
TEXAUGE, a<br />
commercial and<br />
scientific project <strong>for</strong><br />
fast surface and<br />
texture inspection.<br />
Source: Company data, Hauck & Aufhäuser<br />
Customers<br />
Enis Ersü, CEO,<br />
carried out a spin-off<br />
and founded the<br />
<strong>ISRA</strong> <strong>VISION</strong> GmbH.<br />
After the creation of<br />
<strong>ISRA</strong> <strong>VISION</strong> <strong>AG</strong>, the<br />
company went public.<br />
Volkswagen achieved<br />
equipment <strong>for</strong> the<br />
Transparent Factory.<br />
Several acquisitions,<br />
joint-ventures and cooperations<br />
were<br />
placed. Long-term<br />
contractual agreements<br />
were signed.<br />
Due to the various and diversified application areas of the product portfolio, a<br />
broad variety of industries are supplied by <strong>ISRA</strong> Vision.<br />
Industries<br />
<strong>ISRA</strong> <strong>VISION</strong> was<br />
awarded as one of<br />
the TOP 100 most<br />
innovative German<br />
SMEs.<br />
Expansion to Brasilia,<br />
India and Spain.<br />
Today, <strong>ISRA</strong> <strong>VISION</strong><br />
is represented in 13<br />
countries like Japan,<br />
USA, China, UK,<br />
France and others.<br />
Automotive Solar & Photovoltaic Metal Packing Paper,<br />
Specialty Paper<br />
Glass Film & Foils Nonwovens Plastics Print<br />
Source: Company data; Hauck & Aufhäuser<br />
The customer list includes mainly globally producing, blue-chip industrials<br />
including Daimler, VW, Ford, GM, Nissan, Hyundai, Renault, Saint-Gobain,<br />
NSG Group, Pilkington, Asahi Glass, Schott, SolarWorld, WürthSolar, Q.Cells,<br />
Solarwatt, Epcos, aleo, First Solar, JFE, Nippon Steel, Bao Steel, posco, riva,<br />
Corus, ThyssenKrupp, ArcelorMittal, ChinaSteel, Constantia Packaging, MAN,<br />
UPM, M-real, Kimberly-Clark, StoraEnso, International Paper, manroland, Du<br />
Pont, Bayer.<br />
Regional split<br />
<strong>ISRA</strong> Vision <strong>AG</strong> is headquartered in Darmstadt, Germany and represented by<br />
its international subsidiaries and offices worldwide. Due to the early<br />
international expansions, such as <strong>ISRA</strong> Vision, Lansing, Michigan/ USA or<br />
22 Hauck & Aufhäuser Institutional <strong>Research</strong>
<strong>ISRA</strong> Vision<br />
<strong>ISRA</strong> Vision France in Lyon, the company has an almost balanced global<br />
revenue breakdown.<br />
Regional sales 2010<br />
NAFTA<br />
15%<br />
Rest of Europe<br />
24%<br />
Source: Company data, Hauck & Aufhäuser<br />
Asia Pacific,<br />
ROW<br />
38%<br />
Germany<br />
23%<br />
Today, <strong>ISRA</strong> is represented by more than 20 sites in 13 countries worldwide.<br />
Recently the site in Tianjin, China was added while a site in Moscow, Russia is<br />
in preparation. A various number of international joint ventures, acquisitions<br />
and long-term contractual agreements with leading partners is located<br />
strategically close to important customer production facilities.<br />
<strong>ISRA</strong> Vision: Corporate presences<br />
Source: Company data; Hauck & Aufhäuser<br />
Competitors<br />
Competition is characterised by a large number of smaller suppliers and a few<br />
larger, globally active suppliers of machine vision components and solutions.<br />
Cognex Corp., USA; Foundation in 1981; Market cap €975.1m;<br />
Employees 824<br />
Cognex provides machine vision products that capture and analyse visual<br />
in<strong>for</strong>mation to automate tasks, primarily in manufacturing processes. Surface<br />
inspection accounts <strong>for</strong> 15% of 2010 sales. The products include complete<br />
vision systems as well as components. It operates in two divisions: Modular<br />
Vision Systems and Surface Inspection Systems. The first division markets<br />
modular vision systems that are used to automate the manufacture of discrete<br />
items by locating, identifying, inspecting, and measuring them during the<br />
manufacturing process. The Surface Inspection Systems division develops<br />
and provides surface inspection vision systems to inspect the surfaces of<br />
materials processed, such as metals, paper, nonwovens, plastics, and glass.<br />
23 Hauck & Aufhäuser Institutional <strong>Research</strong>
<strong>ISRA</strong> Vision<br />
By end markets, Cognex claims a leading position as a supplier to the<br />
semiconductor and electronics industries since its inception in the early 1980s<br />
as a provider of wafer ID solutions. Since then, Cognex has expanded its<br />
offerings into all industries and provides specific solutions <strong>for</strong> the food and<br />
beverage sectors, packaging industry, solar production and vision guided<br />
robotics solutions.<br />
Perceptron, USA, Foundation in 1981; Market cap €39.3m;<br />
Employees 223<br />
Perceptron was founded as a supplier of high technology, laser-based, noncontact<br />
measurement systems <strong>for</strong> industrial manufacturers to reduce process<br />
variation that occurs in the manufacturing process. Today Perceptron has two<br />
diverse lines of business – the Industrial Business Unit and the Commercial<br />
Products Business Unit.<br />
The Industrial Business Unit provides highly-configurable measurement<br />
solutions that are used by manufacturers to monitor part quality. Perceptron<br />
primarily supplies to the automotive industry, mainly to assembly and<br />
fabrication plants.<br />
The Commercial Products Business Unit was <strong>for</strong>med to diversify Perceptron’s<br />
experience into different market segments. Perceptron’s first commercial<br />
product was initially launched in the spring of 2007. In strategic partnerships<br />
with Snap-on, Rothenberger, Greenlee and Bosch, Perceptron sells visual<br />
inspection products and a line of accessories to mechanics, plumbers,<br />
electricians, heating & cooling contractors, and construction trades people<br />
along with do-it-yourself homeowners.<br />
Additionally, the company offers value-added services comprising training,<br />
field services, launch support services, consulting services, maintenance<br />
agreements, repairs, and software tools. The company operates in the<br />
Americas, Asia and Europe.<br />
AVT, Israel; Foundation in 1992; Market cap €24,6m;<br />
Employees 205<br />
Advanced Vision Technology Ltd. seems to be competitor only in the print end<br />
market. AVT provides products <strong>for</strong> automatic inspection of printed materials<br />
and press control, closed loop colour control, colour management, and<br />
reporting software. The company's main product is used to automatically<br />
detect defects and variations unrecognisable by the human eye in various<br />
printing processes. AVT's vision inspection systems improve output quality<br />
and labour efficiency, and reduce material waste. Further, installation, training<br />
and support services are offered. Advanced Vision Technology sells its<br />
products directly to end users as well as through distributors and strategic<br />
partners in the United States and Europe.<br />
Elexis <strong>AG</strong>, Germany; Foundation in 1995; Market cap €180.3m;<br />
Employees 776<br />
Elexis <strong>AG</strong> manufactures and sells industrial automation systems. Elexis seems<br />
to compete vs. <strong>ISRA</strong> Vision only in its printing division. Its Factory Automation,<br />
Steel, and Printing division involves the manufacture and sale of web and strip<br />
guiding systems that automatically control the strip running of fast moving<br />
materials, such as metal, paper, foil, and rubber. The company’s Factory<br />
Automation, Plastics division produces automated handling systems <strong>for</strong> fast<br />
moving production processes, which ensure the material flow of moulded<br />
plastic components. It sells its products in Europe, America and Asia. On May<br />
9, 2011, SMS Group, a private group manufacturing machinery and complete<br />
plants <strong>for</strong> the steel and plastics extrusion industries, placed a takeover bid of €<br />
19 per Elexis share. The offer price values Elexis at 13.3x PER 2011E and<br />
6.8x EV/EBIT 2011E, based on our assumptions.<br />
24 Hauck & Aufhäuser Institutional <strong>Research</strong>
<strong>ISRA</strong> Vision<br />
Shareholder structure<br />
The major shareholder, Enis Ersü, is the founder and CEO of <strong>ISRA</strong> Vision <strong>AG</strong>.<br />
The free float of 70% is calculated excluding the stakes of the CEO of Vision<br />
GbR. Other shareholdings are included in the free float. The company is<br />
publicly listed in the Prime Standard of the Frankfurt Stock Exchange.<br />
Shareholder structure<br />
other<br />
55%<br />
Henderson<br />
2%<br />
Argos<br />
3%<br />
Vision GbR<br />
5%<br />
Source: Bigdough, Hauck & Aufhäuser<br />
Fidelity<br />
10%<br />
Enis Ersü<br />
(CEO)<br />
25%<br />
25 Hauck & Aufhäuser Institutional <strong>Research</strong>
<strong>ISRA</strong> Vision<br />
Financials<br />
Profit and loss (EUR m) 2006/07 2007/08 2008/09 2009/10 2010/11E 2011/12E 2012/13E<br />
Sales 51.3 68.3 58.2 64.8 74.1 84.0 97.1<br />
Sales growth 7.5 % 33.1 % -14.8 % 11.5 % 14.3 % 13.3 % 15.5 %<br />
Cost of sales 25.2 32.5 28.2 30.5 34.6 39.4 44.6<br />
Gross profit 26.1 35.8 30.0 34.3 39.5 44.6 52.4<br />
Sales and marketing 8.9 11.1 10.3 11.5 13.3 14.9 17.3<br />
General and administration 4.6 4.4 3.8 3.8 4.1 4.5 5.0<br />
<strong>Research</strong> and development 6.4 7.5 7.7 8.3 9.0 10.3 12.3<br />
Other operating income -0.1 0.2 1.0 0.9 0.5 1.2 1.4<br />
Other operating expenses 0.0 0.0 0.0 0.0 0.0 0.0 0.0<br />
Unusual or infrequent items 0.0 0.0 0.0 0.0 0.0 0.0 0.0<br />
EBITDA 10.9 18.6 15.2 17.7 20.7 23.7 27.6<br />
Depreciation 0.5 0.6 0.6 0.6 0.9 1.1 1.7<br />
EBITA 10.4 18.0 14.6 17.0 19.8 22.6 25.8<br />
Amortisation of goodwill 0.0 0.0 0.0 0.0 0.0 0.0 0.0<br />
Amortisation of intangible assets 4.3 5.0 5.4 5.5 6.2 6.4 6.7<br />
Impairment charges 0.0 0.0 0.0 0.0 0.0 0.0 0.0<br />
EBIT 6.2 12.9 9.3 11.5 13.6 16.2 19.1<br />
Interest income 0.2 0.4 0.1 0.1 0.1 0.2 0.2<br />
Interest expenses 0.0 2.0 1.1 0.9 1.1 1.4 1.4<br />
Other financial result 0.0 0.0 0.0 0.0 0.0 0.0 0.0<br />
Financial result 0.2 -1.6 -1.0 -0.9 -1.0 -1.3 -1.2<br />
Recurring pretax income from continuing operations 6.3 11.3 8.3 10.6 12.6 15.0 17.9<br />
Extraordinary income/loss 0.0 0.0 0.0 0.0 0.0 0.0 0.0<br />
Earnings be<strong>for</strong>e taxes 6.3 11.3 8.3 10.6 12.6 15.0 17.9<br />
Taxes 0.8 3.3 1.8 3.6 4.4 5.2 6.3<br />
Net income from continuing operations 5.5 8.0 6.4 7.0 8.2 9.7 11.7<br />
Result from discontinued operations (net of tax) 0.0 0.0 0.0 0.0 0.0 0.0 0.0<br />
Net income 5.5 8.0 6.4 7.0 8.2 9.7 11.7<br />
Minority interest 0.4 0.4 0.0 0.1 0.0 0.0 0.0<br />
Net income (net of minority interest) 5.1 7.6 6.5 7.0 8.2 9.7 11.7<br />
Average number of shares 4.3 4.3 4.3 4.3 4.3 4.3 4.3<br />
EPS reported 1.18 1.76 1.52 1.62 1.88 2.24 2.69<br />
Profit and loss (common size) 2006/07 2007/08 2008/09 2009/10 2010/11E 2011/12E 2012/13E<br />
Sales 100.0 % 100.0 % 100.0 % 100.0 % 100.0 % 100.0 % 100.0 %<br />
Cost of sales 49.1 % 47.6 % 48.4 % 47.1 % 46.7 % 46.9 % 46.0 %<br />
Gross profit 50.9 % 52.4 % 51.6 % 52.9 % 53.3 % 53.1 % 54.0 %<br />
Sales and marketing 17.3 % 16.3 % 17.7 % 17.8 % 17.9 % 17.7 % 17.8 %<br />
General and administration 8.9 % 6.5 % 6.5 % 5.9 % 5.6 % 5.3 % 5.2 %<br />
<strong>Research</strong> and development 12.5 % 11.0 % 13.2 % 12.9 % 12.1 % 12.2 % 12.7 %<br />
Other operating income -0.2 % 0.3 % 1.8 % 1.3 % 0.7 % 1.4 % 1.4 %<br />
Other operating expenses 0.0 % 0.0 % 0.0 % 0.0 % 0.0 % 0.0 % 0.0 %<br />
Unusual or infrequent items 0.0 % 0.0 % 0.0 % 0.0 % 0.0 % 0.0 % 0.0 %<br />
EBITDA 21.3 % 27.2 % 26.1 % 27.2 % 27.9 % 28.2 % 28.4 %<br />
Depreciation 1.0 % 0.9 % 1.0 % 1.0 % 1.2 % 1.3 % 1.8 %<br />
EBITA 20.3 % 26.3 % 25.1 % 26.2 % 26.7 % 26.9 % 26.6 %<br />
Amortisation of goodwill 0.0 % 0.0 % 0.0 % 0.0 % 0.0 % 0.0 % 0.0 %<br />
Amortisation of intangible assets 8.3 % 7.3 % 9.2 % 8.5 % 8.4 % 7.6 % 6.9 %<br />
Impairment charges 0.0 % 0.0 % 0.0 % 0.0 % 0.0 % 0.0 % 0.0 %<br />
EBIT 12.0 % 18.9 % 15.9 % 17.7 % 18.3 % 19.3 % 19.7 %<br />
Interest income 0.3 % 0.6 % 0.2 % 0.1 % 0.2 % 0.2 % 0.2 %<br />
Interest expenses 0.0 % 2.9 % 2.0 % 1.5 % 1.5 % 1.7 % 1.4 %<br />
Other financial result 0.0 % 0.0 % 0.0 % 0.0 % 0.0 % 0.0 % 0.0 %<br />
Financial result 0.3 % -2.3 % -1.7 % -1.4 % -1.4 % -1.5 % -1.2 %<br />
Recurring pretax income from continuing operations 12.3 % 16.6 % 14.2 % 16.4 % 16.9 % 17.8 % 18.5 %<br />
Extraordinary income/loss 0.0 % 0.0 % 0.0 % 0.0 % 0.0 % 0.0 % 0.0 %<br />
Earnings be<strong>for</strong>e taxes 12.3 % 16.6 % 14.2 % 16.4 % 16.9 % 17.8 % 18.5 %<br />
Tax rate 12.4 % 29.5 % 22.3 % 34.0 % 35.0 % 35.0 % 35.0 %<br />
Net income from continuing operations 10.8 % 11.7 % 11.0 % 10.8 % 11.0 % 11.6 % 12.0 %<br />
Result from discontinued operations (net of tax) 0.0 % 0.0 % 0.0 % 0.0 % 0.0 % 0.0 % 0.0 %<br />
Net income 10.8 % 11.7 % 11.0 % 10.8 % 11.0 % 11.6 % 12.0 %<br />
Minority interest 0.8 % 0.6 % -0.1 % 0.1 % 0.0 % 0.0 % 0.0 %<br />
Net income (net of minority interest) 10.0 % 11.1 % 11.1 % 10.7 % 11.0 % 11.6 % 12.0 %<br />
Source: Company data, Hauck & Aufhäuser<br />
26 Hauck & Aufhäuser Institutional <strong>Research</strong>
<strong>ISRA</strong> Vision<br />
Balance sheet (EUR m) 2006/07 2007/08 2008/09 2009/10 2010/11E 2011/12E 2012/13E<br />
Intangible assets 62.0 69.7 71.5 80.4 82.6 84.8 87.6<br />
Property, plant and equipment 2.8 2.6 2.7 2.8 2.6 2.2 1.3<br />
Financial assets 0.0 0.0 0.9 1.2 1.2 1.2 1.2<br />
FIXED ASSETS 64.8 72.3 75.1 84.4 86.3 88.2 90.1<br />
Inventories 15.9 17.2 15.1 14.1 16.2 18.3 21.2<br />
Accounts receivable 31.7 37.8 37.1 46.9 46.7 48.3 51.9<br />
Other current assets 4.6 6.5 2.9 2.3 3.3 3.4 3.6<br />
Liquid assets 22.3 12.6 7.2 8.0 12.5 16.8 20.5<br />
Deferred taxes 3.8 3.3 4.4 5.3 6.3 6.4 6.6<br />
Deferred charges and prepaid expenses 0.0 0.0 0.0 0.0 0.0 0.0 0.0<br />
CURRENT ASSETS 78.3 77.4 66.7 76.6 84.9 93.2 103.7<br />
TOTAL ASSETS 143.1 149.7 141.8 160.9 171.3 181.4 193.8<br />
S<strong>HA</strong>REHOLDERS EQUITY 68.0 74.5 80.4 87.5 96.6 105.4 116.0<br />
MINORITY INTEREST 2.0 1.2 0.8 0.8 0.8 0.8 0.8<br />
Long-term debt 4.2 24.9 26.9 23.2 23.2 23.2 23.2<br />
Provisions <strong>for</strong> pensions and similar obligations 1.6 1.8 1.8 1.9 1.9 1.9 1.9<br />
Other provisions 2.9 1.8 2.7 1.4 1.4 1.4 1.4<br />
Non-current liabilities 8.7 28.5 31.4 26.5 26.5 26.5 26.5<br />
short-term liabilities to banks 25.2 13.5 2.2 11.3 11.3 11.3 11.3<br />
Accounts payable 6.0 8.3 5.3 7.1 8.0 9.1 10.5<br />
Advance payments received on orders 0.0 0.6 0.4 0.0 0.0 0.0 0.0<br />
Other liabilities (incl. from lease and rental contracts) 22.6 10.9 8.2 9.4 9.7 10.0 10.3<br />
Deferred taxes 10.6 12.3 13.0 18.4 18.4 18.4 18.4<br />
Deferred income 0.0 0.0 0.0 0.0 0.0 0.0 0.0<br />
Current liabilities 64.4 45.5 29.2 46.2 47.5 48.8 50.5<br />
TOTAL LIABILITIES AND S<strong>HA</strong>REHOLDERS EQUITY 143.1 149.7 141.8 160.9 171.3 181.4 193.8<br />
Balance sheet (common size) 2006/07 2007/08 2008/09 2009/10 2010/11E 2011/12E 2012/13E<br />
Intangible assets 43.4 % 46.5 % 50.4 % 50.0 % 48.2 % 46.7 % 45.2 %<br />
Property, plant and equipment 1.9 % 1.8 % 1.9 % 1.7 % 1.5 % 1.2 % 0.7 %<br />
Financial assets 0.0 % 0.0 % 0.6 % 0.7 % 0.7 % 0.6 % 0.6 %<br />
FIXED ASSETS 45.3 % 48.3 % 53.0 % 52.4 % 50.4 % 48.6 % 46.5 %<br />
Inventories 11.1 % 11.5 % 10.6 % 8.8 % 9.4 % 10.1 % 10.9 %<br />
Accounts receivable 22.1 % 25.2 % 26.2 % 29.1 % 27.3 % 26.6 % 26.8 %<br />
Other current assets 3.2 % 4.3 % 2.1 % 1.4 % 1.9 % 1.9 % 1.9 %<br />
Liquid assets 15.6 % 8.4 % 5.1 % 5.0 % 7.3 % 9.2 % 10.6 %<br />
Deferred taxes 2.6 % 2.2 % 3.1 % 3.3 % 3.7 % 3.5 % 3.4 %<br />
Deferred charges and prepaid expenses 0.0 % 0.0 % 0.0 % 0.0 % 0.0 % 0.0 % 0.0 %<br />
CURRENT ASSETS 54.7 % 51.7 % 47.1 % 47.6 % 49.6 % 51.4 % 53.5 %<br />
TOTAL ASSETS 100.0 % 100.0 % 100.0 % 100.0 % 100.0 % 100.0 % 100.0 %<br />
S<strong>HA</strong>REHOLDERS EQUITY 47.5 % 49.7 % 56.7 % 54.4 % 56.4 % 58.1 % 59.8 %<br />
MINORITY INTEREST 1.4 % 0.8 % 0.6 % 0.5 % 0.5 % 0.4 % 0.4 %<br />
Long-term debt 2.9 % 16.6 % 19.0 % 14.4 % 13.6 % 12.8 % 12.0 %<br />
Provisions <strong>for</strong> pensions and similar obligations 1.1 % 1.2 % 1.3 % 1.2 % 1.1 % 1.0 % 1.0 %<br />
Other provisions 2.0 % 1.2 % 1.9 % 0.9 % 0.8 % 0.8 % 0.7 %<br />
Non-current liabilities 6.1 % 19.0 % 22.2 % 16.4 % 15.4 % 14.6 % 13.7 %<br />
short-term liabilities to banks 17.6 % 9.0 % 1.6 % 7.0 % 6.6 % 6.2 % 5.8 %<br />
Accounts payable 4.2 % 5.5 % 3.8 % 4.4 % 4.7 % 5.0 % 5.4 %<br />
Advance payments received on orders 0.0 % 0.4 % 0.3 % 0.0 % 0.0 % 0.0 % 0.0 %<br />
Other liabilities (incl. from lease and rental contracts) 15.8 % 7.3 % 5.8 % 5.9 % 5.7 % 5.5 % 5.3 %<br />
Deferred taxes 7.4 % 8.2 % 9.2 % 11.5 % 10.8 % 10.2 % 9.5 %<br />
Deferred income 0.0 % 0.0 % 0.0 % 0.0 % 0.0 % 0.0 % 0.0 %<br />
Current liabilities 45.0 % 30.4 % 20.6 % 28.7 % 27.7 % 26.9 % 26.1 %<br />
TOTAL LIABILITIES AND S<strong>HA</strong>REHOLDERS EQUITY 100.0 % 100.0 % 100.0 % 100.0 % 100.0 % 100.0 % 100.0 %<br />
Source: Company data, Hauck & Aufhäuser<br />
27 Hauck & Aufhäuser Institutional <strong>Research</strong>
<strong>ISRA</strong> Vision<br />
Cash flow statement (EUR m) 2006/07 2007/08 2008/09 2009/10 2010/11E 2011/12E 2012/13E<br />
Net profit/loss 5.5 8.0 6.4 7.0 8.2 9.7 11.7<br />
Depreciation of fixed assets (incl. leases) 0.5 0.6 0.6 0.6 0.9 1.1 1.7<br />
Amortisation of goodwill 0.0 0.0 0.0 0.0 0.0 0.0 0.0<br />
Amortisation of intangible assets 4.3 5.0 5.4 5.5 6.2 6.4 6.7<br />
Others -3.0 0.8 4.3 5.2 0.0 0.0 0.0<br />
Cash flow from operations be<strong>for</strong>e changes in w/c 7.3 14.4 16.7 18.4 15.2 17.2 20.1<br />
Increase/decrease in inventory -3.2 -1.3 2.2 0.4 -2.0 -2.2 -2.8<br />
Increase/decrease in accounts receivable -5.1 -7.9 2.0 -10.9 0.1 -1.6 -3.5<br />
Increase/decrease in accounts payable 7.6 1.1 -4.5 -0.2 1.0 1.1 1.4<br />
Increase/decrease in other working capital positions 0.0 0.0 0.0 0.0 0.0 0.0 0.0<br />
Increase/decrease in working capital -0.6 -8.1 -0.3 -10.6 -0.9 -2.7 -4.9<br />
Cash flow from operating activities 6.7 6.4 16.4 7.7 14.3 14.5 15.2<br />
CAPEX 8.5 9.0 8.9 8.3 9.0 9.3 10.4<br />
Payments <strong>for</strong> acquisitions 17.9 13.5 1.9 1.6 0.0 0.0 0.0<br />
Financial investments 0.0 0.0 0.0 0.2 0.0 0.0 0.0<br />
Income from asset disposals 0.0 0.0 0.0 0.0 0.0 0.0 0.0<br />
Cash flow from investing activities -26.3 -22.5 -10.8 -10.2 -9.0 -9.3 -10.4<br />
Cash flow be<strong>for</strong>e financing -19.6 -16.1 5.5 -2.4 5.3 5.2 4.8<br />
Increase/decrease in debt position 27.2 9.0 -9.2 4.7 0.0 0.0 0.0<br />
Purchase of own shares 0.0 0.5 0.6 0.6 0.0 0.0 0.0<br />
Capital measures 0.0 0.0 0.0 0.0 0.0 0.0 0.0<br />
Dividends paid 0.7 0.7 0.6 0.7 0.9 0.9 1.1<br />
Others 0.3 -1.5 -0.4 -0.4 0.0 0.0 0.0<br />
Effects of exchange rate changes on cash -0.4 0.0 -0.1 0.3 0.0 0.0 0.0<br />
Cash flow from financing activities 26.8 6.3 -10.8 3.0 -0.9 -0.9 -1.1<br />
Increase/decrease in liquid assets 6.8 -9.7 -5.4 0.9 4.4 4.3 3.7<br />
Liquid assets at end of period 22.3 12.5 7.2 8.0 12.5 16.8 20.5<br />
Source: Company data, Hauck & Aufhäuser<br />
Regional split (EUR m) 2006/07 2007/08 2008/09 2009/10 2010/11E 2011/12E 2012/13E<br />
Domestic 0.0 0.0 15.6 15.1 16.2 17.2 19.7<br />
yoy change n/a n/a n/a -3.4 % 7.4 % 6.3 % 14.8 %<br />
Rest of Europe 28.0 34.3 11.2 15.3 17.9 20.1 23.4<br />
yoy change 21.4 % 22.4 % -67.5 % 37.2 % 17.2 % 11.9 % 16.5 %<br />
NAFTA 10.9 10.2 8.4 10.0 11.7 13.1 14.7<br />
yoy change -6.1 % -6.3 % -17.2 % 19.0 % 16.7 % 11.9 % 11.8 %<br />
Asia Pacific 12.4 23.8 23.0 24.5 28.3 33.7 39.3<br />
yoy change -4.8 % 92.1 % -3.5 % 6.4 % 15.8 % 18.8 % 16.8 %<br />
Rest of world 0.0 0.0 0.0 0.0 0.0 0.0 0.0<br />
yoy change n/a n/a n/a n/a n/a n/a n/a<br />
TTL 51.3 68.3 58.2 64.8 74.1 84.0 97.1<br />
yoy change 7.5 % 33.1 % -14.8 % 11.5 % 14.3 % 13.3 % 15.5 %<br />
Source: Company data, Hauck & Aufhäuser<br />
28 Hauck & Aufhäuser Institutional <strong>Research</strong>
<strong>ISRA</strong> Vision<br />
Key ratios (EUR m) 2006/07 2007/08 2008/09 2009/10 2010/11E 2011/12E 2012/13E<br />
P&L growth analysis<br />
Sales growth 7.5 % 33.1 % -14.8 % 11.5 % 14.3 % 13.3 % 15.5 %<br />
EBITDA growth -26.7 % 70.1 % -18.4 % 16.2 % 17.0 % 14.6 % 16.5 %<br />
EBIT growth -36.7 % 110.3 % -28.4 % 24.0 % 18.3 % 19.3 % 18.1 %<br />
EPS growth -22.1 % 48.8 % -13.5 % 6.5 % 16.5 % 19.0 % 19.9 %<br />
Efficiency<br />
Total operating costs / sales 38.9 % 33.5 % 35.6 % 35.2 % 34.9 % 33.8 % 34.3 %<br />
Sales per employee 179.0 203.2 154.9 170.0 176.8 183.9 191.2<br />
EBITDA per employee 38.2 55.4 40.5 46.3 51.4 54.0 57.2<br />
Balance sheet analysis<br />
Avg. working capital / sales 70.2 % 64.2 % 79.6 % 77.4 % 73.4 % 66.9 % 61.9 %<br />
Inventory turnover (sales/inventory) 3.2 4.0 3.9 4.6 4.6 4.6 4.6<br />
Trade debtors in days of sales 225.3 202.0 232.9 263.8 230.0 210.0 195.0<br />
A/P turnover [(A/P*365)/sales] 87.3 93.1 69.2 84.4 84.4 84.0 86.0<br />
Cash conversion cycle (days) 369.1 302.7 359.1 348.4 315.8 295.5 282.0<br />
Cash flow analysis<br />
Free cash flow -1.7 -2.6 7.4 -0.6 5.3 5.2 4.8<br />
Free cash flow/sales -3.4 % -3.8 % 12.8 % -0.9 % 7.1 % 6.2 % 5.0 %<br />
FCF / net profit -34.2 % -34.6 % 115.2 % -8.6 % 64.7 % 53.2 % 41.4 %<br />
FCF yield -2.3 % -3.5 % 10.1 % -0.8 % 7.0 % 6.8 % 6.4 %<br />
Capex / depn 176.5 % 158.8 % 150.4 % 138.7 % 127.7 % 124.5 % 122.8 %<br />
Capex / maintenance capex 11.6 % 11.6 % 11.1 % 9.3 % 9.3 % 9.9 % 10.2 %<br />
Capex / sales 16.5 % 13.2 % 15.3 % 13.2 % 12.2 % 11.1 % 10.7 %<br />
Security<br />
Net debt 7.1 25.8 22.0 26.5 22.0 17.7 14.0<br />
Net Debt/EBITDA 0.6 1.4 1.4 1.5 1.1 0.7 0.5<br />
Net debt / equity 0.1 0.3 0.3 0.3 0.2 0.2 0.1<br />
Interest cover 999.0 6.5 8.2 12.2 11.9 11.6 13.7<br />
Dividend payout ratio 12.7 % 8.5 % 9.9 % 12.4 % 10.6 % 11.2 % 11.2 %<br />
Asset utilisation<br />
Capital employed turnover 0.5 0.6 0.5 0.5 0.5 0.6 0.6<br />
Operating assets turnover 1.2 1.4 1.2 1.1 1.3 1.4 1.5<br />
Plant turnover 18.5 25.8 21.6 23.1 28.6 37.7 72.6<br />
Inventory turnover (sales/inventory) 3.2 4.0 3.9 4.6 4.6 4.6 4.6<br />
Returns<br />
ROCE 7.2 % 11.7 % 8.0 % 9.5 % 10.4 % 11.6 % 12.8 %<br />
ROE 7.5 % 10.2 % 8.0 % 7.9 % 8.5 % 9.2 % 10.1 %<br />
Other<br />
Interest paid / avg. debt 0.0 % 5.9 % 3.4 % 3.0 % 3.3 % 4.1 % 4.1 %<br />
No. employees (average) 287 336 376 382 402 438 482<br />
Number of shares 4.3 4.3 4.3 4.3 4.3 4.3 4.3<br />
DPS 0.2 0.2 0.2 0.2 0.2 0.3 0.3<br />
EPS reported 1.18 1.76 1.52 1.62 1.88 2.24 2.69<br />
Valuation ratios<br />
P/BV 1.1 1.0 0.9 0.9 0.8 0.7 0.7<br />
EV/sales 1.6 1.5 1.7 1.6 1.3 1.1 0.9<br />
EV/EBITDA 7.7 5.5 6.4 5.8 4.8 4.0 3.3<br />
EV/EBITA 8.1 5.7 6.7 6.1 5.0 4.2 3.5<br />
EV/EBIT 13.7 7.9 10.6 9.0 7.3 5.9 4.8<br />
EV/FCF -48.1 -39.1 13.1 -172.1 18.8 18.4 18.9<br />
Dividend yield 0.9 % 0.9 % 0.9 % 1.1 % 1.1 % 1.4 % 1.7 %<br />
Source: Company data, Hauck & Aufhäuser<br />
29 Hauck & Aufhäuser Institutional <strong>Research</strong>
<strong>ISRA</strong> Vision<br />
Disclosure in respect of section 34b of the German Securities Trading Act<br />
(Wertpapierhandelsgesetz – WpHG)<br />
Company Disclosure<br />
<strong>ISRA</strong> Vision <strong>AG</strong> 2, 8<br />
(1) Hauck & Aufhäuser or its affiliate(s) was Lead Manager or Co-Lead Manager over the previous 12 months of a public offering of this<br />
company.<br />
(2) Hauck & Aufhäuser acts as Designated Sponsor <strong>for</strong> this company or offers Equity Advisory Services.<br />
(3) Over the previous 12 months, Hauck & Aufhäuser and/or its affiliate(s) has effected an agreement with this company <strong>for</strong> investment banking<br />
services or received compensation or a promise to pay from this company <strong>for</strong> investment banking services.<br />
(4) Hauck & Aufhäuser and/or its affiliate(s) hold 5 % or more of the share capital of this company.<br />
(5) Hauck & Aufhäuser holds a trading position in shares of this company.<br />
(6) Hauck & Aufhäuser and/or its affiliate(s) holds a net short position of 1 % or more of the share capital of this company, calculated by<br />
methods required by German law as of the last trading day of the past month.<br />
(7) Within the last five years Hauck & Aufhäuser was a member of the issuing syndicate of this company.<br />
(8) The research report has been made available to the company prior to its publication / dissemination. Thereafter, only factual changes have<br />
been made to the report<br />
Historical target price and rating changes <strong>for</strong> <strong>ISRA</strong> Vision <strong>AG</strong> in the last 12 months<br />
Hauck & Aufhäuser distribution of ratings and in proportion to investment banking services<br />
Buy 77.27 % 100.00 %<br />
Sell 6.06 % 0.00 %<br />
Hold 16.67 % 0.00 %<br />
Valuation basis/rating key<br />
Buy: Sustainable upside potential of more than 10% within 12 months.<br />
Sell: Sustainable downside potential of more than 10% within 12 months.<br />
Hold: Upside/downside potential limited. No immediate catalyst visible.<br />
Competent supervisory authority<br />
Initiation coverage<br />
20-June-11<br />
Bundesanstalt für Finanzdienstleistungsaufsicht – BaFin – (Federal Financial Supervisory Authority), Graurheindorfer Straße 108, 53117 Bonn and<br />
Lurgiallee 12, 60439 Frankfurt am Main, Germany<br />
30 Hauck & Aufhäuser Institutional <strong>Research</strong>
<strong>ISRA</strong> Vision<br />
Important Disclosures<br />
This research report has been prepared by Hauck & Aufhäuser Institutional <strong>Research</strong> GmbH, Hamburg, or one of its affiliates (“Hauck &<br />
Aufhäuser”).<br />
Hauck & Aufhäuser has made every ef<strong>for</strong>t to carefully research all in<strong>for</strong>mation contained in this financial analysis. The in<strong>for</strong>mation on which the<br />
financial analysis is based has been obtained from sources which we believe to be reliable such as, <strong>for</strong> example, Reuters, Bloomberg and the<br />
relevant specialised press as well as the company which is the subject of this financial analysis.<br />
Only that part of the research note is made available to the issuer, who is the subject of this analysis, which is necessary to properly reconcile with<br />
the facts. Should this result change considerably, a reference is made in the research note.<br />
Opinions expressed in this financial analysis are the current, personal opinions of the analyst responsible <strong>for</strong> the document as of the issuing date<br />
indicated on this document and are subject to change without notice. Hauck & Aufhäuser does not commit itself in advance to whether and in which<br />
intervals an update is made. Also, the opinions in this document no not necessarily correspond to the opinions of Hauck & Aufhäuser.<br />
The document and the recommendations and estimations contained therein are not linked - whether directly or indirectly - to the compensation of<br />
the analyst responsible <strong>for</strong> the document.<br />
No representation, guarantees or warranties are made by Hauck & Aufhäuser with regard to the accuracy, completeness or suitability regarding all<br />
the in<strong>for</strong>mation on the stocks, stock markets or developments referred to in it.<br />
On no account should the document be regarded as a substitute <strong>for</strong> the recipient’s procuring in<strong>for</strong>mation <strong>for</strong> himself or exercising his own<br />
judgements.<br />
The document has been produced <strong>for</strong> in<strong>for</strong>mation purposes only, and only <strong>for</strong> institutional clients or market professionals. In particular, it is not<br />
intended to be distributed to private investors or private customers. Private investors or private customers, into whose possession this document<br />
comes, should discuss possible investment decisions with their customer service officer as differing views and opinions may exist with regard to the<br />
stocks referred to in this document.<br />
This document is not a recommendation, offer or solicitation to buy or sell the mentioned stock and will not <strong>for</strong>m the basis or a part of any contract.<br />
The document may include certain descriptions, statements, estimates, and conclusions underlining potential market and company development.<br />
These reflect assumptions, which may turn out to be incorrect. Past per<strong>for</strong>mance is not a guide to future results. The price of securities may<br />
decrease or increase and as a result investors may loose the amount originally invested. Changes in exchange rates may also cause the value of<br />
investments to decrease or increase. Hauck & Aufhäuser and/or its directors, officers and employees accept no responsibility or liability whatsoever<br />
<strong>for</strong> any direct or consequential loss or damages of any kind arising out of the use of this document or any part of its content. To the extent this<br />
research report is being transmitted in connection with an existing contractual relationship, e.g. financial advisory or similar services, the liability of<br />
Hauck & Aufhäuser shall be restricted to gross negligence and wilful misconduct. In any case, the liability of Hauck & Aufhäuser is limited to typical,<br />
<strong>for</strong>eseeable damages and liability <strong>for</strong> any indirect damages is excluded.<br />
Hauck & Aufhäuser may act as market-maker or underwrite issues <strong>for</strong> any securities mentioned in this document, derivatives thereon or related<br />
financial products or per<strong>for</strong>m or seek to per<strong>for</strong>m capital market or underwriting services.<br />
Hauck & Aufhäuser reserves all the rights in this document. No part of the document or its content may be rewritten, copied, photocopied or<br />
duplicated in any <strong>for</strong>m by any means or redistributed without Hauck & Aufhäuser’s prior written consent.<br />
Please note that our research is only <strong>for</strong> the personal use of Hauck & Aufhäuser institutional clients. Do not pass on to third parties or<br />
make available to third parties. From time to time Hauck & Aufhäuser Institutional <strong>Research</strong> GmbH will be compensated <strong>for</strong> its services<br />
using soft dollar compensation arrangements, such as trading commissions.<br />
By accepting this document, a recipient hereof agrees to be bound by the <strong>for</strong>egoing limitations.<br />
Remarks regarding <strong>for</strong>eign investors<br />
The preparation of this document is subject to regulation by German law. The distribution of this document in other jurisdictions may be restricted by<br />
law, and persons into whose possession this document comes should in<strong>for</strong>m themselves about, and observe, any such restrictions<br />
31 Hauck & Aufhäuser Institutional <strong>Research</strong>
<strong>ISRA</strong> Vision<br />
Contacts: Hauck&Aufhäuser Investment Banking<br />
Hauck & Aufhäuser <strong>Research</strong><br />
Hauck & Aufhäuser<br />
Institutional <strong>Research</strong> GmbH<br />
Mittelweg 142<br />
20148 Hamburg<br />
Germany<br />
Sascha Berresch, CFA<br />
Analyst<br />
Tel.: +49 (0)40 414 3885 - 85<br />
E-Mail: sascha.berresch@ha-research.de<br />
Marc Osigus, CFA<br />
Analyst<br />
Tel.: +49 (0)40 414 3885 - 90<br />
E-Mail: marc.osigus@ha-research.de<br />
Tim Wunderlich, CFA<br />
Analyst<br />
Tel.: +49 (0)40 414 3885 - 81<br />
E-Mail: tim.wunderlich@ha-research.de<br />
Hauck & Aufhäuser Sales<br />
Vincent Bischoff<br />
Sales<br />
Tel.: +49 (0)40 414 3885 - 88<br />
E-Mail: vincent.bischoff@ha-research.de<br />
Senior Advisors<br />
Graeme Davies<br />
Senior Advisor<br />
Tel.: +49 (0)40 414 3885 - 72<br />
E-Mail: graeme.davies@ha-research.de<br />
Hauck & Aufhäuser Sales Trading<br />
Hauck & Aufhäuser<br />
Privatbankiers KGaA<br />
Kaiserstraße 24<br />
60311 Frankfurt am Main<br />
Germany<br />
Thomas Seibert<br />
Trading<br />
Tel.: +49 (0)69 2161 - 1555<br />
E.Mail: thomas.seibert@hauck-aufhaeuser.de<br />
Tel.: +49 (0) 40 414 3885 - 70<br />
Fax: +49 (0) 40 414 3885 - 71<br />
Email: info@ha-research.de<br />
www.ha-research.de<br />
Henning Breiter<br />
Analyst<br />
Tel.: +49 (0)40 414 3885 - 73<br />
E-Mail: henning.breiter@ha-research.de<br />
Roland Rapelius, CFA<br />
Analyst<br />
Tel.: +49 (0)40 414 3885 - 86<br />
E-Mail: roland.rapelius@ha-research.de<br />
Hugues Madelin<br />
Sales<br />
Tel.: +33 1 78 41 40 62<br />
E-Mail: hugues.madelin@ha-research.de<br />
Michael Schramm<br />
Senior Advisor<br />
Tel.: +49 (0)69 2161 - 1240<br />
E-Mail: michael.schramm@hauck-aufhaeuser.de<br />
Tel.: +49 (0) 69 2161- 0<br />
Fax: +49 (0) 69 2161- 1340<br />
Email: info@hauck-aufhaeuser.de<br />
www.hauck-aufhaeuser.de<br />
Sebastian Schuett<br />
Trading<br />
Tel.: +49 (0)69 2161 – 1556<br />
E.Mail: sebastian.schuett@hauck-aufhaeuser.de<br />
Marie-Therese Gruebner<br />
Analyst<br />
Tel.: +49 (0)40 414 3885 - 83<br />
E-Mail: marie-therese.gruebner@ha-research.de<br />
Thomas Wissler<br />
Analyst<br />
Tel.: +49 (0)40 414 3885 - 80<br />
E-Mail: thomas.wissler@ha-research.de<br />
Toby Woods<br />
Sales<br />
Tel.: +44 207 763 7179<br />
E-Mail: toby.woods@ha-research.de<br />
Jochen Lucht<br />
Senior Advisor<br />
Tel.: +49 (0)69 2161 - 1260<br />
E-Mail: jochen.lucht@hauck-aufhaeuser.de<br />
32 Hauck & Aufhäuser Institutional <strong>Research</strong>