Template for HA Research Notes - ISRA VISION AG
Template for HA Research Notes - ISRA VISION AG
Template for HA Research Notes - ISRA VISION AG

Create successful ePaper yourself
Turn your PDF publications into a flip-book with our unique Google optimized e-Paper software.
<strong>ISRA</strong> Vision<br />
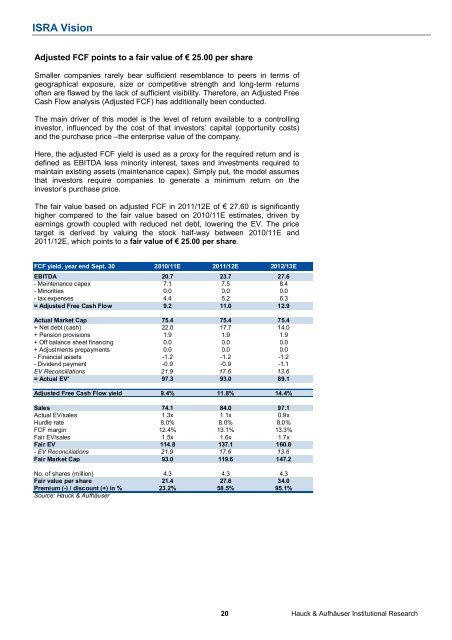
Adjusted FCF points to a fair value of € 25.00 per share<br />
Smaller companies rarely bear sufficient resemblance to peers in terms of<br />
geographical exposure, size or competitive strength and long-term returns<br />
often are flawed by the lack of sufficient visibility. There<strong>for</strong>e, an Adjusted Free<br />
Cash Flow analysis (Adjusted FCF) has additionally been conducted.<br />
The main driver of this model is the level of return available to a controlling<br />
investor, influenced by the cost of that investors’ capital (opportunity costs)<br />
and the purchase price –the enterprise value of the company.<br />
Here, the adjusted FCF yield is used as a proxy <strong>for</strong> the required return and is<br />
defined as EBITDA less minority interest, taxes and investments required to<br />
maintain existing assets (maintenance capex). Simply put, the model assumes<br />
that investors require companies to generate a minimum return on the<br />
investor’s purchase price.<br />
The fair value based on adjusted FCF in 2011/12E of € 27.60 is significantly<br />
higher compared to the fair value based on 2010/11E estimates, driven by<br />
earnings growth coupled with reduced net debt, lowering the EV. The price<br />
target is derived by valuing the stock half-way between 2010/11E and<br />
2011/12E, which points to a fair value of € 25.00 per share.<br />
FCF yield, year end Sept. 30 2010/11E 2011/12E 2012/13E<br />
EBITDA 20.7 23.7 27.6<br />
- Maintenance capex 7.1 7.5 8.4<br />
- Minorities 0.0 0.0 0.0<br />
- tax expenses 4.4 5.2 6.3<br />
= Adjusted Free Cash Flow 9.2 11.0 12.9<br />
Actual Market Cap 75.4 75.4 75.4<br />
+ Net debt (cash) 22.0 17.7 14.0<br />
+ Pension provisions 1.9 1.9 1.9<br />
+ Off balance sheet financing 0.0 0.0 0.0<br />
+ Adjustments prepayments 0.0 0.0 0.0<br />
- Financial assets -1.2 -1.2 -1.2<br />
- Dividend payment -0.9 -0.9 -1.1<br />
EV Reconciliations 21.9 17.6 13.6<br />
= Actual EV' 97.3 93.0 89.1<br />
Adjusted Free Cash Flow yield 9.4% 11.8% 14.4%<br />
Sales 74.1 84.0 97.1<br />
Actual EV/sales 1.3x 1.1x 0.9x<br />
Hurdle rate 8.0% 8.0% 8.0%<br />
FCF margin 12.4% 13.1% 13.3%<br />
Fair EV/sales 1.5x 1.6x 1.7x<br />
Fair EV 114.8 137.1 160.8<br />
- EV Reconciliations 21.9 17.6 13.6<br />
Fair Market Cap 93.0 119.6 147.2<br />
No. of shares (million) 4.3 4.3 4.3<br />
Fair value per share 21.4 27.6 34.0<br />
Premium (-) / discount (+) in % 23.2% 58.5% 95.1%<br />
Source: Hauck & Aufhäuser<br />
20 Hauck & Aufhäuser Institutional <strong>Research</strong>