Template for HA Research Notes - ISRA VISION AG
Template for HA Research Notes - ISRA VISION AG
Template for HA Research Notes - ISRA VISION AG

You also want an ePaper? Increase the reach of your titles
YUMPU automatically turns print PDFs into web optimized ePapers that Google loves.
<strong>ISRA</strong> Vision<br />
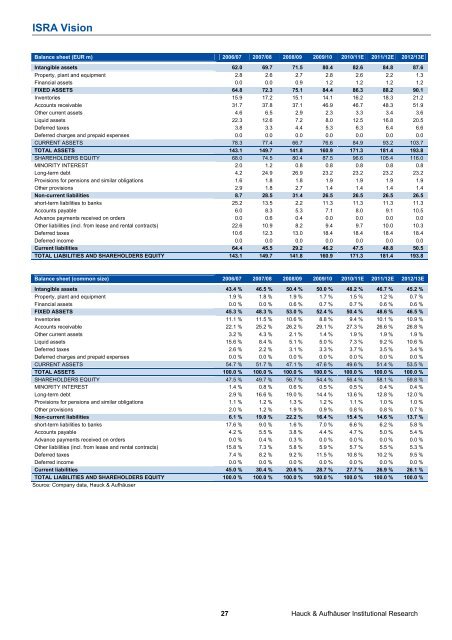
Balance sheet (EUR m) 2006/07 2007/08 2008/09 2009/10 2010/11E 2011/12E 2012/13E<br />
Intangible assets 62.0 69.7 71.5 80.4 82.6 84.8 87.6<br />
Property, plant and equipment 2.8 2.6 2.7 2.8 2.6 2.2 1.3<br />
Financial assets 0.0 0.0 0.9 1.2 1.2 1.2 1.2<br />
FIXED ASSETS 64.8 72.3 75.1 84.4 86.3 88.2 90.1<br />
Inventories 15.9 17.2 15.1 14.1 16.2 18.3 21.2<br />
Accounts receivable 31.7 37.8 37.1 46.9 46.7 48.3 51.9<br />
Other current assets 4.6 6.5 2.9 2.3 3.3 3.4 3.6<br />
Liquid assets 22.3 12.6 7.2 8.0 12.5 16.8 20.5<br />
Deferred taxes 3.8 3.3 4.4 5.3 6.3 6.4 6.6<br />
Deferred charges and prepaid expenses 0.0 0.0 0.0 0.0 0.0 0.0 0.0<br />
CURRENT ASSETS 78.3 77.4 66.7 76.6 84.9 93.2 103.7<br />
TOTAL ASSETS 143.1 149.7 141.8 160.9 171.3 181.4 193.8<br />
S<strong>HA</strong>REHOLDERS EQUITY 68.0 74.5 80.4 87.5 96.6 105.4 116.0<br />
MINORITY INTEREST 2.0 1.2 0.8 0.8 0.8 0.8 0.8<br />
Long-term debt 4.2 24.9 26.9 23.2 23.2 23.2 23.2<br />
Provisions <strong>for</strong> pensions and similar obligations 1.6 1.8 1.8 1.9 1.9 1.9 1.9<br />
Other provisions 2.9 1.8 2.7 1.4 1.4 1.4 1.4<br />
Non-current liabilities 8.7 28.5 31.4 26.5 26.5 26.5 26.5<br />
short-term liabilities to banks 25.2 13.5 2.2 11.3 11.3 11.3 11.3<br />
Accounts payable 6.0 8.3 5.3 7.1 8.0 9.1 10.5<br />
Advance payments received on orders 0.0 0.6 0.4 0.0 0.0 0.0 0.0<br />
Other liabilities (incl. from lease and rental contracts) 22.6 10.9 8.2 9.4 9.7 10.0 10.3<br />
Deferred taxes 10.6 12.3 13.0 18.4 18.4 18.4 18.4<br />
Deferred income 0.0 0.0 0.0 0.0 0.0 0.0 0.0<br />
Current liabilities 64.4 45.5 29.2 46.2 47.5 48.8 50.5<br />
TOTAL LIABILITIES AND S<strong>HA</strong>REHOLDERS EQUITY 143.1 149.7 141.8 160.9 171.3 181.4 193.8<br />
Balance sheet (common size) 2006/07 2007/08 2008/09 2009/10 2010/11E 2011/12E 2012/13E<br />
Intangible assets 43.4 % 46.5 % 50.4 % 50.0 % 48.2 % 46.7 % 45.2 %<br />
Property, plant and equipment 1.9 % 1.8 % 1.9 % 1.7 % 1.5 % 1.2 % 0.7 %<br />
Financial assets 0.0 % 0.0 % 0.6 % 0.7 % 0.7 % 0.6 % 0.6 %<br />
FIXED ASSETS 45.3 % 48.3 % 53.0 % 52.4 % 50.4 % 48.6 % 46.5 %<br />
Inventories 11.1 % 11.5 % 10.6 % 8.8 % 9.4 % 10.1 % 10.9 %<br />
Accounts receivable 22.1 % 25.2 % 26.2 % 29.1 % 27.3 % 26.6 % 26.8 %<br />
Other current assets 3.2 % 4.3 % 2.1 % 1.4 % 1.9 % 1.9 % 1.9 %<br />
Liquid assets 15.6 % 8.4 % 5.1 % 5.0 % 7.3 % 9.2 % 10.6 %<br />
Deferred taxes 2.6 % 2.2 % 3.1 % 3.3 % 3.7 % 3.5 % 3.4 %<br />
Deferred charges and prepaid expenses 0.0 % 0.0 % 0.0 % 0.0 % 0.0 % 0.0 % 0.0 %<br />
CURRENT ASSETS 54.7 % 51.7 % 47.1 % 47.6 % 49.6 % 51.4 % 53.5 %<br />
TOTAL ASSETS 100.0 % 100.0 % 100.0 % 100.0 % 100.0 % 100.0 % 100.0 %<br />
S<strong>HA</strong>REHOLDERS EQUITY 47.5 % 49.7 % 56.7 % 54.4 % 56.4 % 58.1 % 59.8 %<br />
MINORITY INTEREST 1.4 % 0.8 % 0.6 % 0.5 % 0.5 % 0.4 % 0.4 %<br />
Long-term debt 2.9 % 16.6 % 19.0 % 14.4 % 13.6 % 12.8 % 12.0 %<br />
Provisions <strong>for</strong> pensions and similar obligations 1.1 % 1.2 % 1.3 % 1.2 % 1.1 % 1.0 % 1.0 %<br />
Other provisions 2.0 % 1.2 % 1.9 % 0.9 % 0.8 % 0.8 % 0.7 %<br />
Non-current liabilities 6.1 % 19.0 % 22.2 % 16.4 % 15.4 % 14.6 % 13.7 %<br />
short-term liabilities to banks 17.6 % 9.0 % 1.6 % 7.0 % 6.6 % 6.2 % 5.8 %<br />
Accounts payable 4.2 % 5.5 % 3.8 % 4.4 % 4.7 % 5.0 % 5.4 %<br />
Advance payments received on orders 0.0 % 0.4 % 0.3 % 0.0 % 0.0 % 0.0 % 0.0 %<br />
Other liabilities (incl. from lease and rental contracts) 15.8 % 7.3 % 5.8 % 5.9 % 5.7 % 5.5 % 5.3 %<br />
Deferred taxes 7.4 % 8.2 % 9.2 % 11.5 % 10.8 % 10.2 % 9.5 %<br />
Deferred income 0.0 % 0.0 % 0.0 % 0.0 % 0.0 % 0.0 % 0.0 %<br />
Current liabilities 45.0 % 30.4 % 20.6 % 28.7 % 27.7 % 26.9 % 26.1 %<br />
TOTAL LIABILITIES AND S<strong>HA</strong>REHOLDERS EQUITY 100.0 % 100.0 % 100.0 % 100.0 % 100.0 % 100.0 % 100.0 %<br />
Source: Company data, Hauck & Aufhäuser<br />
27 Hauck & Aufhäuser Institutional <strong>Research</strong>