Template for HA Research Notes - ISRA VISION AG
Template for HA Research Notes - ISRA VISION AG
Template for HA Research Notes - ISRA VISION AG

Create successful ePaper yourself
Turn your PDF publications into a flip-book with our unique Google optimized e-Paper software.
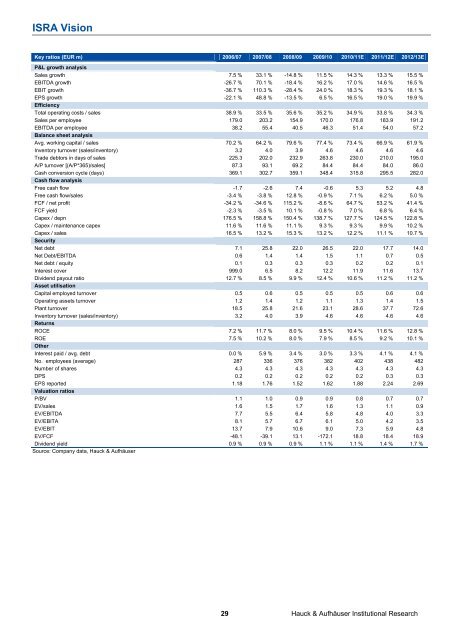
<strong>ISRA</strong> Vision<br />
Key ratios (EUR m) 2006/07 2007/08 2008/09 2009/10 2010/11E 2011/12E 2012/13E<br />
P&L growth analysis<br />
Sales growth 7.5 % 33.1 % -14.8 % 11.5 % 14.3 % 13.3 % 15.5 %<br />
EBITDA growth -26.7 % 70.1 % -18.4 % 16.2 % 17.0 % 14.6 % 16.5 %<br />
EBIT growth -36.7 % 110.3 % -28.4 % 24.0 % 18.3 % 19.3 % 18.1 %<br />
EPS growth -22.1 % 48.8 % -13.5 % 6.5 % 16.5 % 19.0 % 19.9 %<br />
Efficiency<br />
Total operating costs / sales 38.9 % 33.5 % 35.6 % 35.2 % 34.9 % 33.8 % 34.3 %<br />
Sales per employee 179.0 203.2 154.9 170.0 176.8 183.9 191.2<br />
EBITDA per employee 38.2 55.4 40.5 46.3 51.4 54.0 57.2<br />
Balance sheet analysis<br />
Avg. working capital / sales 70.2 % 64.2 % 79.6 % 77.4 % 73.4 % 66.9 % 61.9 %<br />
Inventory turnover (sales/inventory) 3.2 4.0 3.9 4.6 4.6 4.6 4.6<br />
Trade debtors in days of sales 225.3 202.0 232.9 263.8 230.0 210.0 195.0<br />
A/P turnover [(A/P*365)/sales] 87.3 93.1 69.2 84.4 84.4 84.0 86.0<br />
Cash conversion cycle (days) 369.1 302.7 359.1 348.4 315.8 295.5 282.0<br />
Cash flow analysis<br />
Free cash flow -1.7 -2.6 7.4 -0.6 5.3 5.2 4.8<br />
Free cash flow/sales -3.4 % -3.8 % 12.8 % -0.9 % 7.1 % 6.2 % 5.0 %<br />
FCF / net profit -34.2 % -34.6 % 115.2 % -8.6 % 64.7 % 53.2 % 41.4 %<br />
FCF yield -2.3 % -3.5 % 10.1 % -0.8 % 7.0 % 6.8 % 6.4 %<br />
Capex / depn 176.5 % 158.8 % 150.4 % 138.7 % 127.7 % 124.5 % 122.8 %<br />
Capex / maintenance capex 11.6 % 11.6 % 11.1 % 9.3 % 9.3 % 9.9 % 10.2 %<br />
Capex / sales 16.5 % 13.2 % 15.3 % 13.2 % 12.2 % 11.1 % 10.7 %<br />
Security<br />
Net debt 7.1 25.8 22.0 26.5 22.0 17.7 14.0<br />
Net Debt/EBITDA 0.6 1.4 1.4 1.5 1.1 0.7 0.5<br />
Net debt / equity 0.1 0.3 0.3 0.3 0.2 0.2 0.1<br />
Interest cover 999.0 6.5 8.2 12.2 11.9 11.6 13.7<br />
Dividend payout ratio 12.7 % 8.5 % 9.9 % 12.4 % 10.6 % 11.2 % 11.2 %<br />
Asset utilisation<br />
Capital employed turnover 0.5 0.6 0.5 0.5 0.5 0.6 0.6<br />
Operating assets turnover 1.2 1.4 1.2 1.1 1.3 1.4 1.5<br />
Plant turnover 18.5 25.8 21.6 23.1 28.6 37.7 72.6<br />
Inventory turnover (sales/inventory) 3.2 4.0 3.9 4.6 4.6 4.6 4.6<br />
Returns<br />
ROCE 7.2 % 11.7 % 8.0 % 9.5 % 10.4 % 11.6 % 12.8 %<br />
ROE 7.5 % 10.2 % 8.0 % 7.9 % 8.5 % 9.2 % 10.1 %<br />
Other<br />
Interest paid / avg. debt 0.0 % 5.9 % 3.4 % 3.0 % 3.3 % 4.1 % 4.1 %<br />
No. employees (average) 287 336 376 382 402 438 482<br />
Number of shares 4.3 4.3 4.3 4.3 4.3 4.3 4.3<br />
DPS 0.2 0.2 0.2 0.2 0.2 0.3 0.3<br />
EPS reported 1.18 1.76 1.52 1.62 1.88 2.24 2.69<br />
Valuation ratios<br />
P/BV 1.1 1.0 0.9 0.9 0.8 0.7 0.7<br />
EV/sales 1.6 1.5 1.7 1.6 1.3 1.1 0.9<br />
EV/EBITDA 7.7 5.5 6.4 5.8 4.8 4.0 3.3<br />
EV/EBITA 8.1 5.7 6.7 6.1 5.0 4.2 3.5<br />
EV/EBIT 13.7 7.9 10.6 9.0 7.3 5.9 4.8<br />
EV/FCF -48.1 -39.1 13.1 -172.1 18.8 18.4 18.9<br />
Dividend yield 0.9 % 0.9 % 0.9 % 1.1 % 1.1 % 1.4 % 1.7 %<br />
Source: Company data, Hauck & Aufhäuser<br />
29 Hauck & Aufhäuser Institutional <strong>Research</strong>