Template for HA Research Notes - ISRA VISION AG
Template for HA Research Notes - ISRA VISION AG
Template for HA Research Notes - ISRA VISION AG

You also want an ePaper? Increase the reach of your titles
YUMPU automatically turns print PDFs into web optimized ePapers that Google loves.
<strong>ISRA</strong> Vision<br />
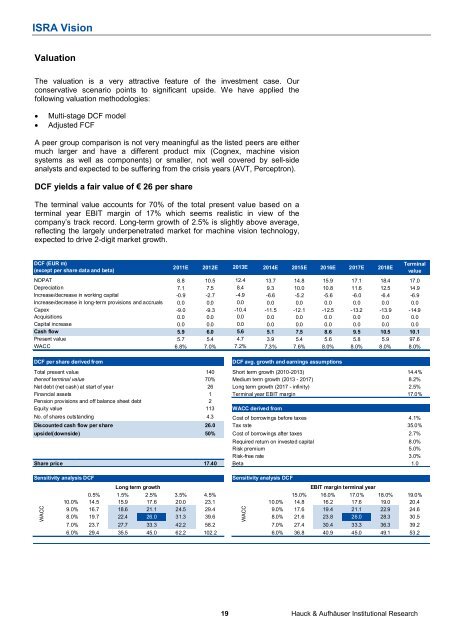
Valuation<br />
The valuation is a very attractive feature of the investment case. Our<br />
conservative scenario points to significant upside. We have applied the<br />
following valuation methodologies:<br />
• Multi-stage DCF model<br />
• Adjusted FCF<br />
A peer group comparison is not very meaningful as the listed peers are either<br />
much larger and have a different product mix (Cognex, machine vision<br />
systems as well as components) or smaller, not well covered by sell-side<br />
analysts and expected to be suffering from the crisis years (AVT, Perceptron).<br />
DCF yields a fair value of € 26 per share<br />
The terminal value accounts <strong>for</strong> 70% of the total present value based on a<br />
terminal year EBIT margin of 17% which seems realistic in view of the<br />
company’s track record. Long-term growth of 2.5% is slightly above average,<br />
reflecting the largely underpenetrated market <strong>for</strong> machine vision technology,<br />
expected to drive 2-digit market growth.<br />
DCF (EUR m)<br />
(except per share data and beta)<br />
NOPAT<br />
Depreciation<br />
Increase/decrease in working capital<br />
Increase/decrease in long-term provisions and accruals<br />
Capex<br />
Acquisitions<br />
Capital increase<br />
Cash flow<br />
Present value<br />
WACC<br />
2011E 2012E 2013E 2014E 2015E 2016E 2017E 2018E<br />
Terminal<br />
value<br />
8.8 10.5 12.4 13.7 14.8 15.9 17.1 18.4 17.0<br />
7.1 7.5 8.4 9.3 10.0 10.8 11.6 12.5 14.9<br />
-0.9 -2.7 -4.9 -6.6 -5.2 -5.6 -6.0 -6.4 -6.9<br />
0.0 0.0 0.0 0.0 0.0 0.0 0.0 0.0 0.0<br />
-9.0 -9.3 -10.4 -11.5 -12.1 -12.5 -13.2 -13.9 -14.9<br />
0.0 0.0 0.0 0.0 0.0 0.0 0.0 0.0 0.0<br />
0.0 0.0 0.0 0.0 0.0 0.0 0.0 0.0 0.0<br />
5.9 6.0 5.6 5.1 7.5 8.6 9.5 10.5 10.1<br />
5.7 5.4 4.7 3.9 5.4 5.6 5.8 5.9 97.6<br />
6.8% 7.0% 7.2% 7.3% 7.6% 8.0% 8.0% 8.0% 8.0%<br />
DCF per share derived from DCF avg. growth and earnings assumptions<br />
Total present value 140 Short term growth (2010-2013) 14.4%<br />
thereof terminal value 70% Medium term growth (2013 - 2017) 8.2%<br />
Net debt (net cash) at start of year 26 Long term growth (2017 - infinity) 2.5%<br />
Financial assets 1 Terminal year EBIT margin 17.0%<br />
Pension provisions and off balance sheet debt 2<br />
Equity value 113 WACC derived from<br />
No. of shares outstanding<br />
4.3<br />
Cost of borrowings be<strong>for</strong>e taxes 4.1%<br />
Discounted cash flow per share 26.0 Tax rate 35.0%<br />
upside/(downside) 50% Cost of borrowings after taxes 2.7%<br />
Required return on invested capital 8.0%<br />
Risk premium 5.0%<br />
Risk-free rate 3.0%<br />
Share price 17.40 Beta 1.0<br />
Sensitivity analysis DCF Sensitivity analysis DCF<br />
WACC<br />
Long term growth EBIT margin terminal year<br />
26.0 0.5% 1.5% 2.5% 3.5% 4.5% 26.0 15.0% 16.0% 17.0% 18.0% 19.0%<br />
10.0% 14.5 15.9 17.6 20.0 23.1 10.0% 14.8 16.2 17.6 19.0 20.4<br />
9.0% 16.7 18.6 21.1 24.5 29.4 9.0% 17.6 19.4 21.1 22.9 24.6<br />
8.0% 19.7 22.4 26.0 31.3 39.6 8.0% 21.6 23.8 26.0 28.3 30.5<br />
WACC<br />
7.0% 23.7 27.7 33.3 42.2 58.2 7.0% 27.4 30.4 33.3 36.3 39.2<br />
6.0% 29.4 35.5 45.0 62.2 102.2 6.0% 36.8 40.9 45.0 49.1 53.2<br />
19 Hauck & Aufhäuser Institutional <strong>Research</strong>