Template for HA Research Notes - ISRA VISION AG
Template for HA Research Notes - ISRA VISION AG
Template for HA Research Notes - ISRA VISION AG

You also want an ePaper? Increase the reach of your titles
YUMPU automatically turns print PDFs into web optimized ePapers that Google loves.
<strong>ISRA</strong> Vision<br />
ROCE Decomposition<br />
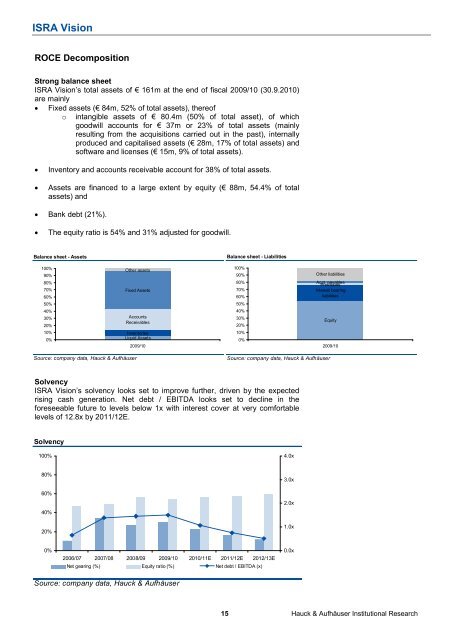
Strong balance sheet<br />
<strong>ISRA</strong> Vision’s total assets of € 161m at the end of fiscal 2009/10 (30.9.2010)<br />
are mainly<br />
• Fixed assets (€ 84m, 52% of total assets), thereof<br />
o intangible assets of € 80.4m (50% of total asset), of which<br />
goodwill accounts <strong>for</strong> € 37m or 23% of total assets (mainly<br />
resulting from the acquisitions carried out in the past), internally<br />
produced and capitalised assets (€ 28m, 17% of total assets) and<br />
software and licenses (€ 15m, 9% of total assets).<br />
• Inventory and accounts receivable account <strong>for</strong> 38% of total assets.<br />
• Assets are financed to a large extent by equity (€ 88m, 54.4% of total<br />
assets) and<br />
• Bank debt (21%).<br />
• The equity ratio is 54% and 31% adjusted <strong>for</strong> goodwill.<br />
Balance sheet - Assets<br />
100%<br />
90%<br />
80%<br />
70%<br />
60%<br />
50%<br />
40%<br />
30%<br />
20%<br />
10%<br />
0%<br />
Source: company data, Hauck & Aufhäuser<br />
Other assets<br />
Fixed Assets<br />
Accounts<br />
Receivables<br />
Inventories<br />
Liquid Assets<br />
2009/10<br />
Balance sheet - Liabilities<br />
Source: company data, Hauck & Aufhäuser<br />
Solvency<br />
<strong>ISRA</strong> Vision’s solvency looks set to improve further, driven by the expected<br />
rising cash generation. Net debt / EBITDA looks set to decline in the<br />
<strong>for</strong>eseeable future to levels below 1x with interest cover at very com<strong>for</strong>table<br />
levels of 12.8x by 2011/12E.<br />
Solvency<br />
100%<br />
80%<br />
60%<br />
40%<br />
20%<br />
0%<br />
100%<br />
2006/07 2007/08 2008/09 2009/10 2010/11E 2011/12E 2012/13E<br />
Net gearing (%) Equity ratio (%) Net debt / EBITDA (x)<br />
Source: company data, Hauck & Aufhäuser<br />
90%<br />
80%<br />
70%<br />
60%<br />
50%<br />
40%<br />
30%<br />
20%<br />
10%<br />
0%<br />
4.0x<br />
3.0x<br />
2.0x<br />
1.0x<br />
0.0x<br />
Other liabilities<br />
Acct. payables<br />
Provisions<br />
Interest bearing<br />
liabilities<br />
Equity<br />
2009/10<br />
15 Hauck & Aufhäuser Institutional <strong>Research</strong>