Template for HA Research Notes - ISRA VISION AG
Template for HA Research Notes - ISRA VISION AG
Template for HA Research Notes - ISRA VISION AG

Create successful ePaper yourself
Turn your PDF publications into a flip-book with our unique Google optimized e-Paper software.
<strong>ISRA</strong> Vision<br />
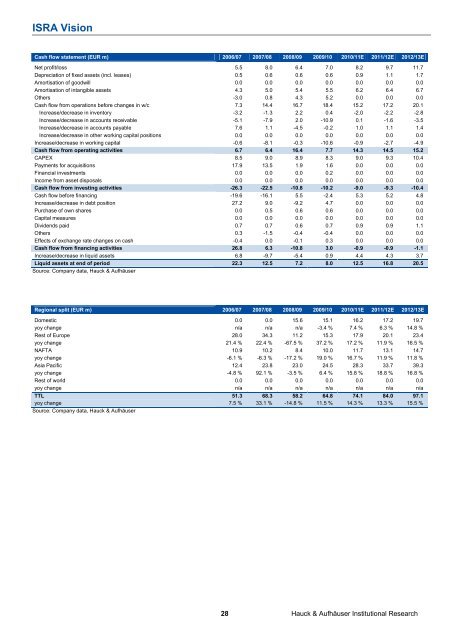
Cash flow statement (EUR m) 2006/07 2007/08 2008/09 2009/10 2010/11E 2011/12E 2012/13E<br />
Net profit/loss 5.5 8.0 6.4 7.0 8.2 9.7 11.7<br />
Depreciation of fixed assets (incl. leases) 0.5 0.6 0.6 0.6 0.9 1.1 1.7<br />
Amortisation of goodwill 0.0 0.0 0.0 0.0 0.0 0.0 0.0<br />
Amortisation of intangible assets 4.3 5.0 5.4 5.5 6.2 6.4 6.7<br />
Others -3.0 0.8 4.3 5.2 0.0 0.0 0.0<br />
Cash flow from operations be<strong>for</strong>e changes in w/c 7.3 14.4 16.7 18.4 15.2 17.2 20.1<br />
Increase/decrease in inventory -3.2 -1.3 2.2 0.4 -2.0 -2.2 -2.8<br />
Increase/decrease in accounts receivable -5.1 -7.9 2.0 -10.9 0.1 -1.6 -3.5<br />
Increase/decrease in accounts payable 7.6 1.1 -4.5 -0.2 1.0 1.1 1.4<br />
Increase/decrease in other working capital positions 0.0 0.0 0.0 0.0 0.0 0.0 0.0<br />
Increase/decrease in working capital -0.6 -8.1 -0.3 -10.6 -0.9 -2.7 -4.9<br />
Cash flow from operating activities 6.7 6.4 16.4 7.7 14.3 14.5 15.2<br />
CAPEX 8.5 9.0 8.9 8.3 9.0 9.3 10.4<br />
Payments <strong>for</strong> acquisitions 17.9 13.5 1.9 1.6 0.0 0.0 0.0<br />
Financial investments 0.0 0.0 0.0 0.2 0.0 0.0 0.0<br />
Income from asset disposals 0.0 0.0 0.0 0.0 0.0 0.0 0.0<br />
Cash flow from investing activities -26.3 -22.5 -10.8 -10.2 -9.0 -9.3 -10.4<br />
Cash flow be<strong>for</strong>e financing -19.6 -16.1 5.5 -2.4 5.3 5.2 4.8<br />
Increase/decrease in debt position 27.2 9.0 -9.2 4.7 0.0 0.0 0.0<br />
Purchase of own shares 0.0 0.5 0.6 0.6 0.0 0.0 0.0<br />
Capital measures 0.0 0.0 0.0 0.0 0.0 0.0 0.0<br />
Dividends paid 0.7 0.7 0.6 0.7 0.9 0.9 1.1<br />
Others 0.3 -1.5 -0.4 -0.4 0.0 0.0 0.0<br />
Effects of exchange rate changes on cash -0.4 0.0 -0.1 0.3 0.0 0.0 0.0<br />
Cash flow from financing activities 26.8 6.3 -10.8 3.0 -0.9 -0.9 -1.1<br />
Increase/decrease in liquid assets 6.8 -9.7 -5.4 0.9 4.4 4.3 3.7<br />
Liquid assets at end of period 22.3 12.5 7.2 8.0 12.5 16.8 20.5<br />
Source: Company data, Hauck & Aufhäuser<br />
Regional split (EUR m) 2006/07 2007/08 2008/09 2009/10 2010/11E 2011/12E 2012/13E<br />
Domestic 0.0 0.0 15.6 15.1 16.2 17.2 19.7<br />
yoy change n/a n/a n/a -3.4 % 7.4 % 6.3 % 14.8 %<br />
Rest of Europe 28.0 34.3 11.2 15.3 17.9 20.1 23.4<br />
yoy change 21.4 % 22.4 % -67.5 % 37.2 % 17.2 % 11.9 % 16.5 %<br />
NAFTA 10.9 10.2 8.4 10.0 11.7 13.1 14.7<br />
yoy change -6.1 % -6.3 % -17.2 % 19.0 % 16.7 % 11.9 % 11.8 %<br />
Asia Pacific 12.4 23.8 23.0 24.5 28.3 33.7 39.3<br />
yoy change -4.8 % 92.1 % -3.5 % 6.4 % 15.8 % 18.8 % 16.8 %<br />
Rest of world 0.0 0.0 0.0 0.0 0.0 0.0 0.0<br />
yoy change n/a n/a n/a n/a n/a n/a n/a<br />
TTL 51.3 68.3 58.2 64.8 74.1 84.0 97.1<br />
yoy change 7.5 % 33.1 % -14.8 % 11.5 % 14.3 % 13.3 % 15.5 %<br />
Source: Company data, Hauck & Aufhäuser<br />
28 Hauck & Aufhäuser Institutional <strong>Research</strong>