MATELAN Research - ISRA VISION AG
MATELAN Research - ISRA VISION AG
MATELAN Research - ISRA VISION AG

Create successful ePaper yourself
Turn your PDF publications into a flip-book with our unique Google optimized e-Paper software.
<strong>MATELAN</strong> <strong>Research</strong><br />
Closing price as of 28/08/11: €17.4<br />
In-Depth Report<br />
01 September 2011<br />
Company / Sector Fair Value Recommendation<br />
<strong>ISRA</strong> <strong>VISION</strong><br />
€23.6<br />
Buy<br />
Technology (€23.0) (unchanged)<br />
Shifting gears<br />
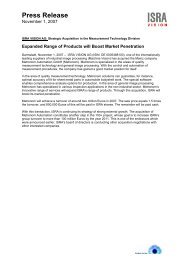
Share price performance Investment case<br />
Uncertainties regarding 2012 are currently weighing on equity<br />
35<br />
markets, thereby creating interesting investment opportunities.<br />
30<br />
25<br />
20<br />
At <strong>ISRA</strong>, operations are currently accelerating due to its strong<br />
positions in a late cyclical market. Q3 orders suggest that<br />
15<br />
10<br />
double-digit growth should last into 2012 and we have even<br />
5<br />
raised our estimates going forward. Already reflecting slower<br />
0<br />
05/05 05/06 05/07<br />
<strong>ISRA</strong><br />
05/08 05/09 05/10<br />
SDAX (Ind.)<br />
05/11 growth beyond 2012 and using a higher risk premium, still<br />
yields an upside of 35% to our fair value.<br />
Share data<br />
Reuters ISRG.DE<br />
Bloomberg ISR.GY<br />
No. of shares 4.33<br />
Daily turnover 7,776<br />
Free Float 70%<br />
Market Cap. 75.4<br />
EV 104.7<br />
Valuation 2011 2012<br />
EV/Sales 1.4 1.3<br />
EV/EBITDA 5.0 4.4<br />
EV/EBIT 7.6 6.3<br />
PER 8.5 7.1<br />
Div. Yield 1.2% 1.3%<br />
RoCE 7.8% 8.6%<br />
RoE 9.3% 10.0%<br />
� MV MARKET GROWTH EXPECTED TO LAST<br />
Following a strong recovery in 2010 and 2011, markets are now<br />
worried about an economic slowdown in 2012. So far, a recession<br />
should not be expected and due its late cyclical nature, the MV<br />
market should still grow solidly. Beyond 2012, we price-in slower<br />
growth but the market should still outpace the global economy due<br />
to technological improvements, lower prices and new applications.<br />
� <strong>ISRA</strong> PLAYING ON ITS STRENGTHS<br />
On the back of its global presence, a broad product range, a strong<br />
home base, a strong exposure to high growth regions and dominance<br />
in many markets, <strong>ISRA</strong> is currently outpacing its competitors in key<br />
divisions. Moreover, the company launches new products and<br />
intends to consolidate the highly fragmented market further.<br />
� 35% UPSIDE ON CONSERVATIVE ESITMATES<br />
Q3 figures continued to show strong growth and orders suggest<br />
double-digit growth also in 2012. We have thus raised our estimates<br />
further while remaining conservative. Even including a higher risk<br />
premium, we still arrive at a fair value of EUR23.6, which already<br />
gives the stock an upside of 35% and leaves further headroom.<br />
For additional disclosures please refer to the appendix<br />
Analyst Forecasts 2010 2011e 2012e 2013e 2014e 2015e<br />
Sales 64.85 74.88 82.37 87.31 92.55 98.10<br />
EBITDA 17.65 20.82 23.70 25.36 27.62 29.96<br />
EBIT 11.49 13.82 16.38 17.77 19.57 21.42<br />
Dr. Anne Gronski Adj. EPS 1.62 2.06 2.46 2.68 2.97 3.27<br />
Tel.: +49 228 227 99 238 Dividend 0.20 0.21 0.22 0.23 0.24 0.26<br />
Anne.gronski@matelan.de Oper. CF 6.86 11.43 12.27 17.14 17.14 19.20<br />
www.matelan.de Free CF -3.32 0.69 2.47 7.70 7.02 8.36
<strong>ISRA</strong> <strong>VISION</strong> In-Depth Report<br />
TABLE OF CONTENTS<br />
- 2 -<br />
Executive Summary ........................................................................................ 3<br />
Valuation .......................................................................................................... 5<br />
Market Structure & Developments ............................................................ 10<br />
Regional Macroeconomic Trends Stimulate Market .......................... 11<br />
Revival of Traditional Customer Industries ........................................ 13<br />
Discrete Inspection Systems Remain Key Application ..................... 15<br />
Trend Towards Less Complex Products ............................................. 16<br />
Numerous Drivers of Future Growth ................................................. 18<br />
Company Profile and Strategy .................................................................... 20<br />
Strongly Positioned in Key Growth Regions ...................................... 20<br />
Broad Diversification Across Industries .............................................. 21<br />
Differentiating from the Competition .................................................. 22<br />
Strategic Expansion of Activities .......................................................... 25<br />
Capitalizing on Growth Trends ............................................................ 27<br />
Financial Analysis ......................................................................................... 29<br />
Drawing a Conservative Growth Scenario .......................................... 29<br />
Working Capital is the Main Balance Sheet Lever ............................. 31<br />
Back to Positive Free Cash Flows ........................................................ 32<br />
Q3 Sends Positive Signals for 2012 ...................................................... 33<br />
ADDITIONAL DISCLOSURES ........................................................................ 40<br />
DISCLAIMER ................................................................................................... 40<br />
ADDITIONAL INFORMATION ....................................................................... 41<br />
CONTACT DATA ............................................................................................ 41
<strong>ISRA</strong> <strong>VISION</strong> In-Depth Report<br />
EXECUTIVE SUMMARY<br />
Economic recovery<br />
stimulating the<br />
European machine<br />
vision market - German<br />
companies excellently<br />
positioned<br />
Numerous drivers of<br />
growth: + 20% expected<br />
for 2011<br />
Order intake secures<br />
sound development in<br />
2012<br />
<strong>ISRA</strong> attractively<br />
positioned to benefit<br />
from regional growth<br />
trends while being<br />
broadly diversified<br />
across customer<br />
industries<br />
Broad product range and<br />
global reach give <strong>ISRA</strong><br />
an edge over most<br />
competitors<br />
- 3 -<br />
Following a sharp contraction during the recession year 2009, the European<br />
market for machine vision technology showed a strong comeback in 2010 on<br />
the back of a recovering global economy. This economic recovery was mainly<br />
driven by the Asian markets, in particular China. Within Europe, Germany<br />
experienced the strongest economic growth, while most other nations were<br />
still struggling. This puts German machine vision companies in a favourable<br />
position as they not only have the largest home market, but also an aboveaverage<br />
exposure to China, the strongest growth driver worldwide.<br />
Economic growth, particularly coming from the emerging markets, increasing<br />
automation in the US and the strength of the German economy are clear<br />
growth drivers for the machine vision market going forward. Looking at<br />
customer industries, we see the traditional industries showing a strong<br />
comeback. Automotive and electrical goods showed the highest growth rates<br />
in 2010 and are expected to continue to do so in 2011. The pharma industry<br />
has good prospects and is rather resistant to a potential economic slowdown.<br />
In industries such as glass and metal, the industry background looks<br />
somewhat more heterogeneous but some machine vision companies are still<br />
reporting good order intake from these industries. We should continue to see<br />
discrete inspection systems as the most important application but 3D systems<br />
and new application should increasingly become drivers of growth. In terms<br />
of products, there is currently a trend towards less complex systems, though<br />
vision systems will continue to dominate the market as they become<br />
increasingly powerful at lower prices. On the back of all these growth drivers,<br />
the EMVA assumes a market increase of 20% for the current year.<br />
Markets are currently worried about a potential slowdown of global economic<br />
growth in 2012. However, most indicators are so far not pointing to a<br />
recession. Growth must be expected to slow from the 2011 level but remain<br />
positive. As a consequence of the late cyclical nature of the machine vision<br />
industry, we would expect the economic slowdown to show only with a time<br />
lag. In fact, order intake remains strong and suggests that the trends<br />
described above will continue in 2012 at slightly lower rates.<br />
Within a rather fragmented industry, <strong>ISRA</strong> counts among the leading<br />
companies and is one of the few global players. Though Europe is still the<br />
most important region for the company, overseas sales already account for<br />
half of the business. In fact, China has become the second largest location<br />
after Germany. Moreover, <strong>ISRA</strong> is broadly diversified across most customer<br />
industries. Originating from the automotive industry, metal, paper and glass<br />
now also account for major parts of the company’s sales. We thus feel that<br />
the company should benefit strongly from regional growth trends, while<br />
being in a position to even out the different cycles of the customer industries.<br />
Looking at the competition, only Cognex matches <strong>ISRA</strong>’s broad<br />
diversification across the industries and its global reach. Though dealing with<br />
much larger customers is never easy, <strong>ISRA</strong>’s ability to serve its customers<br />
globally with a broad product range gives the company a clear edge over most<br />
competitors. Moreover, <strong>ISRA</strong> clearly dominates markets such as glass and
<strong>ISRA</strong> <strong>VISION</strong> In-Depth Report<br />
Leveraging strong<br />
market positions and<br />
driving growth with new<br />
product initiatives<br />
Double-digit net profit<br />
growth based on<br />
conservative top-line and<br />
margin assumptions<br />
Further progress in<br />
NWC could unlock<br />
additional value –<br />
positive free cash flows<br />
from coming year<br />
onwards<br />
Q3 follows up on strong<br />
Q2 numbers – doubledigit<br />
growth also<br />
expected for next year<br />
Conservatively calculated<br />
fair value of EUR23.6<br />
CCA and CTA point at<br />
further headroom.<br />
- 4 -<br />
metal with shares of 80% and 65%, respectively. This makes it hard for the<br />
customer to find acceptable alternatives.<br />
<strong>ISRA</strong> is clearly differentiating itself from the competition through is global<br />
presence, its broad product range and technological leadership in many areas.<br />
Moreover, the company is currently undertaking some initiatives to fuel<br />
further growth in the industrial automation segment with new product<br />
launches and we expect the company to continue its successful strategic<br />
expansion in the surface vision segment.<br />
Based on the positive developments that <strong>ISRA</strong> is currently experiencing as a<br />
result of improving market dynamics as well as the company’s strong position<br />
in its relevant markets, our current growth assumption of 8.6% over the<br />
medium-term appears rather conservative and takes into account a potential<br />
economic slowdown. In particular, we have not yet priced-in management’s<br />
target of more than EUR100m in sales in the coming years. We also assume<br />
only a slight margin increase. Still, net profit growth comes to a C<strong>AG</strong>R of<br />
15.2%, which means a doubling over the coming 5 years.<br />
One of the key financial drivers – apart from earnings development – is<br />
working capital. <strong>ISRA</strong> clearly has above-average working capital needs and<br />
improvements on this side could unlock substantial value for the company.<br />
Against the background of its low capital intensity, <strong>ISRA</strong> is still earning its<br />
cost of capital and shows an industry average RoCE, when excluding<br />
goodwill. Despite the financing of numerous acquisitions, <strong>ISRA</strong> still shows a<br />
low gearing. Although the company is likely to further consolidate the<br />
market, we are not pricing-in any acquisitions. This leaves the company in a<br />
position to produce positive free cash flows from the current year onwards.<br />
The third quarter sustained the strong picture presented in the second<br />
quarter, leaving our full year estimates too conservative. We have thus raised<br />
our esitmates without becoming aggressive. Order intake accelerated further<br />
and led to a further increase in the order book. A quarter of our sales forecast<br />
for the coming year is already in the books and we expect this to double by<br />
year-end. Against this background, management has not only reiterated its<br />
guidance for the current year, it also expects double-digit growth in the<br />
coming year, even in view of the current uncertainties regarding the<br />
macroeconomic environment.<br />
We value <strong>ISRA</strong>’s stock on the back of the financials described above. Our<br />
DCF analysis arrives at a fair value of EUR23.6 when sticking to the<br />
conservative approach that we had already used in estimating the company’s<br />
financials and employing an increased market risk premium to reflect current<br />
uncertainties on equity markets. A normalization of the risk perception would<br />
even drive this value to EUR26.5. Our peer group analysis shows that <strong>ISRA</strong><br />
trades at a significant discount to the average multiples of its peers, in<br />
particular on a PE basis. Implicit multiples on the base of our fair value bring<br />
<strong>ISRA</strong>’s PE in line with the average of its closest peers. Applying average<br />
multiples of all peers to <strong>ISRA</strong>’s earnings yields values in the range of<br />
EUR20.8 to EUR30.2. Moreover, <strong>ISRA</strong> trades at PE discounts of 14.8% and<br />
9.8% to the Elexis transaction even based on our valuation before the risk<br />
adjustment. Our conservative DCF valuation thus not only gives the share an<br />
upside of 35%, the comparable company analysis as well as the comparable<br />
transaction analysis supports the view that there is still further headroom in<br />
our valuation.
<strong>ISRA</strong> <strong>VISION</strong> In-Depth Report<br />
VALUATION<br />
DCF and peer group<br />
valuation<br />
Three stage DCF model<br />
Conservative long-term<br />
assumptions for growth,<br />
margins …<br />
… and WACC<br />
calculation<br />
Fair value of EUR23.6<br />
- 5 -<br />
For valuation purposes, we use a detailed DCF model and a peer group<br />
comparison based on the most important valuation multiples. While the DCF<br />
model is our main valuation tool, which allows for an in-depth discussion of<br />
<strong>ISRA</strong>’s most important value drivers, the peer group comparison is used as a<br />
validity check for our results.<br />
Our DCF model calculates <strong>ISRA</strong>’s fair value by discounting the company’s<br />
future free cash flows. In the first phase, we derive the free cash flows from<br />
our detailed financial modelling, which is discussed in the financial section of<br />
this report. The cash flows are then estimated via linearization of all<br />
important value drivers to a normalized value. From the latter, the terminal<br />
value is calculated.<br />
As the terminal value assumptions in particular have a large impact on the<br />
valuation, we have kept them conservative: We have, for example, set the<br />
growth rate of total output to 1.5%, which is merely reflecting inflation. We<br />
thus assume no real growth in <strong>ISRA</strong>’s total output in the terminal value. To<br />
underline this, we have equated the depreciation rate with the rate of<br />
investment, meaning that the company is only replacing its capital invested in<br />
the business and not expanding it. In addition, we have set the EBITDA<br />
margin slightly below its value in the last explicitly estimated period (i.e.<br />
2014/15). Moreover, we have not assumed any further improvements in<br />
<strong>ISRA</strong>’s working capital in the terminal value.<br />
All free cash-flows are discounted with the company’s weighted average cost<br />
of capital. This is based on the current forward rates of German government<br />
bonds as risk-free rates. To determine the cost of debt, we add the credit<br />
spread and adjust the tax shield. On the equity side, we add a market risk<br />
premium, which is weighted with a beta factor. In order to reflect current<br />
uncertainties with regard to the economic development in 2012, which is<br />
documented in the recent sell-off on equity markets, we have raised the<br />
market risk premium for small caps by 1pp to now 7%. The beta factor is<br />
derived fundamentally, taking into account the company’s risk profile as<br />
summarized below. In the case of <strong>ISRA</strong>, we see a higher risk compared to the<br />
market in all risk categories, which results in a final beta factor of 1.2.<br />
Weighting the cost of equity and debt with the market values of the<br />
company’s equity and debt, we come to WACCs between 7.5% and 11.4%<br />
for the years under review.<br />
All assumptions of our valuation are detailed in the table below and result in a<br />
fair value of EUR23.6, which provides the share with an upside of roughly<br />
35% to the current price. It should be highlighted that under the same set of<br />
assumptions our fair value would come to EUR26.5 if we had not raised the<br />
market risk premium. This represents an additional upside if equity markets<br />
start to normalise and <strong>ISRA</strong> delivers on the expected earnings streams.
<strong>ISRA</strong> <strong>VISION</strong> In-Depth Report<br />
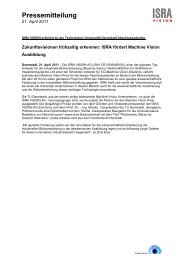
DCF model<br />
EURm 01/09/2011 30/09/2011 30/09/2012 30/09/2013 30/09/2014 30/09/2015 30/09/2016 30/09/2017 30/09/2018 30/09/2019 30/09/2020 30/09/2021<br />
Total Output 82.9 91.5 96.1 101.9 108.2 114.0 119.2 123.7 127.5 130.4 132.3<br />
Growth 10.4% 5.0% 6.1% 6.1% 5.3% 4.6% 3.8% 3.0% 2.3% 1.5%<br />
Operating costs -62.1 -67.8 -70.7 -74.3 -86.8 -91.6 -96.1 -100.0 -103.3 -106.0 -107.8<br />
EBITDA 20.8 23.7 25.4 27.6 30.0 31.4 32.7 33.8 34.7 35.4 35.7<br />
Margin 25.1% 25.9% 26.4% 27.1% 27.7% 27.6% 27.5% 27.4% 27.2% 27.1% 27.0%<br />
Depreciation and amortisation -7.0 -7.3 -7.6 -8.1 -8.5 -9.1 -9.7 -10.1 -10.6 -11.0 -11.2<br />
EBIT 13.8 16.4 17.8 19.6 21.4 22.3 23.1 23.7 24.1 24.4 24.5<br />
Margin 16.7% 17.9% 18.5% 19.2% 19.8% 19.6% 19.4% 19.2% 18.9% 18.7% 18.5%<br />
Operating cash-taxes -4.0 -4.8 -5.2 -5.8 -6.4 -6.6 -6.7 -6.8 -6.9 -6.9 -6.9<br />
Other adjustments 0.0 0.0 0.0 0.0 0.0 0.0 0.0 0.0 0.0 0.0 0.0<br />
NOPLAT 9.8 11.6 12.5 13.8 15.0 15.7 16.3 16.8 17.2 17.5 17.6<br />
Change 18.2% 8.2% 9.9% 9.2% 4.6% 3.9% 3.1% 2.3% 1.5% 0.7%<br />
Depreciation and amortisation 7.0 7.3 7.6 8.1 8.5 9.1 9.7 10.1 10.6 11.0 11.2<br />
Operating cash flow 16.8 18.9 20.1 21.8 23.6 24.8 26.0 27.0 27.8 28.4 28.9<br />
Capital expenditure -10.7 -9.8 -9.4 -10.1 -10.8 -11.1 -11.3 -11.5 -11.5 -11.4 -11.2<br />
Change in working capital -3.1 -5.9 -3.1 -4.0 -4.3 -4.0 -3.6 -3.1 -2.6 -2.0 -1.4<br />
Free cash flow 3.0 3.2 7.5 7.7 8.5 9.7 11.1 12.4 13.7 15.0 16.3<br />
Cost of capital 7.5% 8.1% 8.5% 8.9% 9.2% 9.5% 9.7% 9.9% 10.1% 10.2% 11.4%<br />
Capital employed 104.5 105.8 117.4 125.9 134.4 140.4 145.6 150.1 153.6 156.0<br />
RoCE 9.4% 10.9% 10.7% 10.9% 11.2% 11.2% 11.2% 11.2% 11.2% 11.2%<br />
Spread 1.8% 2.9% 2.2% 2.0% 2.0% 1.7% 1.6% 1.3% 1.1% 1.0%<br />
Present value of operating cash flows 132.8 3.0 2.9 6.5 6.0 6.1 6.4 6.7 6.8 6.9 6.9 74.6<br />
Non operating assets 6.0<br />
Enterprise value 138.8 Risk profile Assumptions for termial value<br />
Debt -33.8 Cyclical exposure 25.0% 1.1 Long term growth rate 1.5%<br />
Pension provisions -1.9 Transparency 35.0% 1.0 EBIT-margin 18.5%<br />
Minorities -0.8 Size/Liquidity 10.0% 1.3 Risk free rate 5.5%<br />
Equity Value 102.3 Leverage 30.0% 1.4 Risk premium 7.0%<br />
Number of shares 4.3 Other 0.0% 1.0 Credit spread 1.5%<br />
Value per share 23.6 Fundamental beta 1.2 Equity ratio 74.1%<br />
Source: <strong>MATELAN</strong> <strong>Research</strong><br />
Consistent value<br />
generation<br />
Model appears to be<br />
rather stable<br />
- 6 -<br />
The model also shows that <strong>ISRA</strong> is consistently producing a higher return on<br />
capital employed compared to its cost of capital, thereby generating value<br />
throughout the model. However, the spread between the ROCE and the cost<br />
of capital is declining over time, which is mainly a result of our conservative<br />
assumption of net working capital development. Here we see a source of<br />
further potential upgrades in our valuation.<br />
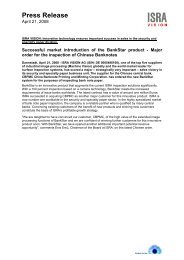
Apart from working capital, sustainable levels for growth, EBIT margin,<br />
required capex levels and cost of capital are the most important variables in<br />
our fair value calculation. Against this background, we have performed a<br />
sensitivity analysis for a 1pp change in each of these variables. The following<br />
chart shows that this leads to a change in the fair value of up to 7.6%. This<br />
shows that the model is rather stable and leaves sufficient upside for the<br />
share even if we saw a negative change in one of the variables. It should be<br />
mentioned, that a 1pp change in the NWC-ratio is probably underrepresenting<br />
the leverage here due to the high base value.<br />
Sensitivity analysis<br />
Growth<br />
EBIT margin<br />
Investments<br />
Working Capital<br />
Cost of Capital<br />
Source: <strong>MATELAN</strong> <strong>Research</strong>, in EUR<br />
21.6 22.6 23.6 24.6 25.6<br />
+/- 100bp
<strong>ISRA</strong> <strong>VISION</strong> In-Depth Report<br />
Building a broad peer<br />
group<br />
No peer fully<br />
comparable to <strong>ISRA</strong><br />
Overview of the positioning of the peers<br />
Fields of Business<br />
Comment<br />
Source: <strong>MATELAN</strong> <strong>Research</strong><br />
- 7 -<br />
In addition to the DCF model, we have applied a peer group analysis based<br />
on the most common multiples, EV/Sales, EV/EBITDA, EV/EBIT and PE<br />
for the FY 2011 and 2012, respectively. Among the listed machine vision<br />
companies, Basler and Viscom are probably the closest peers as they are also<br />
listed in Germany and they are also pure machine vision companies. In order<br />
to get a broader perspective of the valuation of machine vision companies,<br />
we do also look at the companies listed abroad (Cognex, Perceptron and<br />
Orbotech) and AVT, which has shifted focus to some extent following the<br />
acquisition of GMI. In addition, we have looked at Elexis, which is also not a<br />
pure machine vision company but offers a broad portfolio of automation<br />
technologies to the steel, printing and plastics industry. Elexis is currently<br />
being taken-over and thus yields decent transaction multiples.<br />
A short overview of the competitors is provided in the table below. It shows<br />
that companies vary greatly in the degree of diversification, ranging from<br />
highly focused small players such as Viscom, AVT and Perceptron to large<br />
players, such as Orbotech and Cognex. It has to be noted that none of the<br />
players are fully comparable to <strong>ISRA</strong> as each one only partly matches <strong>ISRA</strong>’s<br />
industry mix. More information as to what extent they compete with <strong>ISRA</strong><br />
can be found in the section on the competitive landscape.<br />
Basler Viscom Cognex Perceptron Orbotech AVT Elexis<br />
Approx. 80% of sales<br />
come from MV<br />
components,<br />
particularly digital<br />
cameras. Remainder<br />
is achieved with<br />
inspection solutions<br />
for LCD glass.<br />
Profits from strong<br />
demand for<br />
components. Weak<br />
solutions business was<br />
scaled down: Optical<br />
Media Inspection,<br />
Sealing Inspection &<br />
Solar Wafer<br />
Inspection were sold<br />
to a strategic investor<br />
Considering different<br />
reporting years …<br />
… and accounting<br />
standards<br />
Leading supplier of<br />
inspection systems<br />
for the electronics<br />
industry<br />
High dependency on<br />
the electronics<br />
industry as well as on<br />
a few large<br />
customers. Profits<br />
from strong upswing<br />
in demand from the<br />
electronics industry<br />
Worldwide #1 one<br />
in optical inspection<br />
components.<br />
Leading supplier of<br />
optical inspection<br />
solutions to a broad<br />
range of industries.<br />
Profits from high<br />
demand for<br />
components and<br />
compact 'ready to<br />
use' vision systems<br />
Supplier of<br />
measurement and<br />
inspection<br />
applications for<br />
automotive and<br />
manufacturing<br />
companies<br />
Leading supplier of optical<br />
inspection systems for the<br />
production of printed<br />
circuit boards and flat<br />
panel displays<br />
High dependency on Profits from strong<br />
the automobile upswing in demand from<br />
industry. Solutions the electronics industry<br />
base on laser<br />
technology. Profits<br />
from high demand<br />
from the automobile<br />
industry.<br />
Leading supplier of<br />
advanced optical<br />
inspection systems<br />
for the packaging and<br />
label printing<br />
industry. Also a<br />
leading supplier of<br />
pressroom<br />
automation systems.<br />
High dependency on<br />
the printing industry.<br />
Company reports in<br />
USD, while share<br />
trades in Euro,<br />
weakening of the<br />
USD thus has a<br />
negative impact on<br />
valuation.<br />
Supplier of factory<br />
automation<br />
technologies for the<br />
steel, printing and<br />
plastics industry.<br />
Elexis is currently<br />
being taken over by<br />
SMS GmbH which<br />
already holds an<br />
84.4% equity stake in<br />
the company.<br />
For the interpretation of results from the peer group comparison it is<br />
important to keep two points in mind that result from different accounting<br />
practices: <strong>ISRA</strong>, as well as Cognex and Perceptron, have broken fiscal years.<br />
In essence, this should lead to an increase of the premium for the fiscal year<br />
under consideration that comprises more of the previous calendar year. That<br />
means, this would justify multiples for Cognex (FY ends in June) being higher<br />
than for <strong>ISRA</strong> (FY ends in September). <strong>ISRA</strong>’s multiples again should be<br />
higher than Basler’s, where the fiscal year corresponds to the calendar year.<br />
The second bias results from the companies’ different treatment of<br />
development costs: while all companies reporting in accordance with IFRS<br />
are required to activate development costs, those who report in accordance<br />
with US GAAP are not. This effect can skew margins in favour of the<br />
former. As activated development costs are being written down over a certain<br />
period of time, the margin difference is highest with regard to EBITDA and<br />
is somewhat mitigated at lower levels. Two main conclusions arise from this:<br />
firstly, valuation-wise it justifies per se a certain premium for those reporting
<strong>ISRA</strong> <strong>VISION</strong> In-Depth Report<br />
Higher margins justify<br />
premium<br />
Peer group comparison<br />
- 8 -<br />
in accordance with US GAAP, and secondly, the focus of this analysis should<br />
be on EV/EBIT and PE rather than on the EV/EBITDA or EV/Sales<br />
multiples.<br />
Overview of the use of accounting standards<br />
Company<br />
Accounting<br />
principles<br />
Headquarters Listed in<br />
<strong>ISRA</strong> Vision IFRS Germany Germany<br />
Basler IFRS Germany Germany<br />
Viscom IFRS Germany Germany<br />
Cognex US GAAP USA USA<br />
Perceptron US GAAP USA USA<br />
Orbotech US GAAP Israel USA<br />
AVT US GAAP Israel Germany<br />
Elexis<br />
Source: <strong>MATELAN</strong> <strong>Research</strong><br />
IFRS Germany Germany<br />
For better comparability, the margins for <strong>ISRA</strong> are calculated on the basis of<br />
net sales only (in contrast to the remainder of the report where we calculate<br />
margins as a percentage of total output, i.e. including capitalized items). While<br />
growth is roughly in line with the market, we find that <strong>ISRA</strong> has the second<br />
highest margins among the peers, which clearly justifies a premium compared<br />
to the other companies.<br />
Basler Viscom Cognex Perceptron Orbotech AVT Elexis Average <strong>ISRA</strong> <strong>ISRA</strong> (FV)<br />
Currency EUR EUR USD USD USD USD EUR EUR EUR<br />
FY end Dec 31 Dec 31 Dec 31 June 30 Dec 31 Dec 31 Dec 31 Sept 30 Sept 30<br />
Share price 10.8 7.0 35.4 6.0 11.5 4.9 20.4 17.4 23.6<br />
No of share (m) 3.5 9.0 41.5 8.7 35.4 5.3 9.2 4.3 4.3<br />
Market cap 37.7 63.0 1467.5 51.5 406.6 26.1 187.2 75.4 102.3<br />
Net debt 19.5 -23.6 -33.2 -9.8 -56.8 -10.8 -11.0 26.5 26.5<br />
Pension provisions 0.0 0.3 0.0 0.0 27.5 0.0 8.6 1.9 1.9<br />
Minorities 0.0 0.0 0.0 0.0 1.9 0.0 2.9 0.8 0.8<br />
Participations 0.0 -3.2 -249.9 -10.3 0.0 0.0 -2.8 0.0 0.0<br />
Enterprise Value 57.2 36.6 1184.4 31.5 379.2 15.3 184.9 101.9 128.8<br />
Sales 55.1 52.0 323.0 56.5 574.0 43.4 168.5 74.9 74.9<br />
EBITDA 14.4 9.6 98.4 2.7 n.a. 3.5 27.6 20.8 20.8<br />
Margin 26.1% 18.5% 30.5% 4.8% n.a. 8.1% 16.4% 27.8% 27.8%<br />
EBIT 7.4 8.6 84.9 1.6 81.9 2.7 24.1 13.8 13.8<br />
Margin 13.3% 16.6% 26.3% 2.9% 14.3% 6.2% 14.3% 18.5% 18.5%<br />
Adj. Net Profit 4.0 6.9 66.7 1.4 67.6 2.9 14.7 8.9 8.9<br />
EV/Sales 1.0 0.7 3.7 0.6 0.7 0.4 1.1 1.2 1.4 1.7<br />
EV/EBITDA 4.0 3.8 12.0 11.7 n.a. 4.4 6.7 7.6 4.9 6.2<br />
EV/EBIT 7.8 4.2 14.0 19.3 4.6 5.7 7.7 9.0 7.4 9.3<br />
PE 9.5 9.2 22.0 37.1 6.0 9.1 12.8 15.1 8.4 11.5<br />
Sales 56.6 58.0 361.0 62.0 622.0 48.5 179.5 82.4 82.4<br />
Growth 2.7% 11.5% 11.8% 9.7% 8.4% 11.6% 6.5% 10.0% 10.0%<br />
EBITDA 14.2 9.6 114.0 4.4 n.a. 4.8 29.5 23.7 23.7<br />
Margin 25.1% 16.5% 31.6% 7.1% n.a. 9.9% 16.4% 28.8% 28.8%<br />
EBIT 7.0 8.6 101.8 3.4 93.9 3.9 26.0 16.4 16.4<br />
Margin 12.3% 14.9% 24.9% 5.4% 15.1% 8.0% 14.5% 19.9% 19.9%<br />
Adj. Net Profit 3.8 6.5 79.1 2.4 78.4 3.6 16.3 10.7 10.7<br />
EV/Sales 1.0 0.6 3.3 0.5 0.6 0.3 1.0 1.1 1.2 1.6<br />
EV/EBITDA 4.0 3.8 10.4 7.1 n.a. 3.2 6.3 6.3 4.3 5.4<br />
EV/EBIT 8.2 4.2 11.6 9.3 4.0 3.9 7.1 6.9 6.2 7.9<br />
PE 9.9 9.7 18.6 21.5 5.2 7.3 11.5 12.0 7.1 9.6<br />
Source: <strong>MATELAN</strong> <strong>Research</strong>, Bloomberg, company reports (last FY), closing prices and consensus estimates as of 28/08/11<br />
2011e<br />
2012e
<strong>ISRA</strong> <strong>VISION</strong> In-Depth Report<br />
Strong discount on PE<br />
basis<br />
Peer group supports our<br />
DCF valuation<br />
Elexis transaction shows<br />
that our valuation is still<br />
not stretched<br />
Peers point at additional<br />
upside for <strong>ISRA</strong><br />
Risks to our valuation<br />
- 9 -<br />
Based on EV/Sales multiples, <strong>ISRA</strong> trades with a sizable premium compared<br />
to its peers. More importantly, <strong>ISRA</strong> trades at a material discount to its peers,<br />
even the close ones, on almost all earnings multiples.<br />
We also find that the peer group analysis is perfectly consistent with our DCF<br />
calculation. Looking at the multiples that are implied in our DCF valuation,<br />
we find that our DCF calculation brings EV / EBITDA and EV/EBIT<br />
multiples roughly in line with the industry average and PEs even in line with<br />
the close peers.<br />
It must also be highlighted that <strong>ISRA</strong> is currently trading substantially below<br />
the transaction multiples that result from the current offer for Elexis.<br />
Furthermore, even our DCF valuation arrives at multiples that are not yet<br />
aligned with the Elexis offer, in particular on a PE basis. It should be kept in<br />
mind that the Elexis offer took place before the recent sell-off in the equity<br />
markets and is thus unaffected by the increased risk in the global economic<br />
situation. However, even our DCF valuation of <strong>ISRA</strong> before the risk<br />
adjustment would yield PE multiples 14.8% and 9.8% below the respective<br />
Elexis multiples for the years 2011 and 2012.<br />
In addition, we have applied the peer group multiples shown above to <strong>ISRA</strong>’s<br />
earnings in order to arrive at a share price for <strong>ISRA</strong> that is consistent with the<br />
current valuation of the peers. The following table shows a valuation range<br />
for each multiple determined by the second highest and the second lowest<br />
value and taking the average of the resulting values in the years 2011 and<br />
2012. We have left out the highest and lowest multiple in order to eliminate<br />
outliers. We also show the value determined by the average of the peer group.<br />
The chart makes it clear that employing an EV/Sales multiple does not lead<br />
to reasonable results, which can be explained by <strong>ISRA</strong>’s above average<br />
profitability. Looking at average values shows a price range of EUR20.8-30.2<br />
for <strong>ISRA</strong> across the earnings multiples. It should also be remembered that<br />
this methodology does not yet take into account the FY and the margin bias.<br />
Price ranges for <strong>ISRA</strong> based on peer group<br />
50.0<br />
45.0<br />
40.0<br />
35.0<br />
30.0<br />
25.0<br />
20.0<br />
15.0<br />
10.0<br />
5.0<br />
0.0<br />
EV / Sales EV / EBITDA EV / EBIT PE<br />
Source: <strong>MATELAN</strong> <strong>Research</strong>, in EUR per share<br />
Finally, it must be pointed out, that although the risk of an economic<br />
downturn is already reflected in our DCF (increased risk premium) and our<br />
peer group (reduced prices of peers) valuations, a major recession actually<br />
materialising would lead to further adjustments. This is a remaining risk to<br />
our analysis, though the upside appears to be higher at this point in time.
<strong>ISRA</strong> <strong>VISION</strong> In-Depth Report<br />
MARKET STRUCTURE & DEVELOPMENTS<br />
Key component of<br />
automation processes<br />
and beyond<br />
Combining different<br />
components to an entire<br />
system<br />
Market coming back to<br />
double-digit growth rates<br />
again<br />
- 10 -<br />
Machine vision is an interdisciplinary technology that combines in particular<br />
lighting, optics, electronics, information technology, software and automation<br />
technology in order to improve industrial but also non-industrial processes.<br />
The main objective is to capture pictures within a production process and<br />
analyse them according to previously defined patterns. This encompasses the<br />
guidance of movements for robots or automated vehicles (robot vision),<br />
controlling production processes e.g. for fast moving materials (surface<br />
vision) or check for completeness (quality vision), and allows the machines to<br />
work faster, in a more precise way and without human intervention. Apart<br />
from these industrial applications, fields such as monitoring areas for security<br />
purposes, controlling traffic flows or driver assistance systems are of<br />
increasing importance.<br />
The main components for a standard machine vision system are (1) lighting,<br />
that ensures that the images captured by the cameras are optimal for the<br />
subsequent analysis, (2) cameras that capture the images, (3) cables and<br />
interfaces that bring the information to the computer and (4) the computer,<br />
which does the final processing. In addition to these hardware components, a<br />
software steering the processes is needed. Apart from such modular systems,<br />
vision systems can be more compact, i.e. in the form of cameras that have<br />
integrated processing and illumination.<br />
Machine vision has become a core tool for further improving automation<br />
processes in the industry and other areas of society and daily life. The market<br />
has thus experienced strong growth since its break-through in the early 80s.<br />
New applications in areas such as safety and security, life sciences,<br />
entertainment, criminology, medical engineering are now likely to drive<br />
growth further in the years to come. The following chart show that the<br />
German machine vision market, one of the largest in the world and for which<br />
a fair history has been recorded, has experienced an average growth rate of<br />
8.4% over the past ten years. While the first half of the decade showed<br />
consistently sound double-digit growth rates, growth had slipped to single<br />
digit in the second half. Moreover, it shows that the financial and economic<br />
crisis in 2009 has had a severe impact on the German machine vision<br />
industry, driving down sales by 21%. The year 2010 brought, however, a<br />
tremendous recovery, coming in even ahead of the previous peak year 2008.<br />
Though growth in 2011 will not match the exceptional rate seen in 2010, it is<br />
still expected to continue at a double-digit rate.
<strong>ISRA</strong> <strong>VISION</strong> In-Depth Report<br />
Economic recovery has<br />
driven the machine<br />
vision market<br />
Asian markets lead<br />
global economic<br />
recovery, Germany<br />
shines in Europe<br />
- 11 -<br />
Growth of the German machine vision market<br />
1600<br />
1400<br />
1200<br />
1000<br />
800<br />
600<br />
400<br />
200<br />
0<br />
2000<br />
2001<br />
Source: VDMA, EURm<br />
2002<br />
2003<br />
2004<br />
2005<br />
-10%<br />
-20%<br />
-30%<br />
REGIONAL MACROECONOMIC TRENDS STIMULATE MARKET<br />
The machine vision market tends to follow economic cycles as it is mainly<br />
driven by capital expenditure of the users of this technology. These tend to<br />
expand their capacities in good times but reduce their capital expenditure<br />
when it is getting harder. Looking at the global economy, we find a stronger<br />
than expected recovery in 2010 from the financial and economic crisis a year<br />
earlier. This has had a very positive impact on the European machine vision<br />
landscape, as we had already illustrated for the case of Germany.<br />
GDP growth in key regions<br />
2008 2009 2010 2011E 2012E<br />
Germany 1.0% -4.7% 3.6% 3.5% 1.8%<br />
France -0.2% -2.6% 1.4% 2.2% 1.4%<br />
Italy -1.3% -5.2% 1.2% 0.8% 1.1%<br />
UK -0.1% -4.9% 1.3% 1.1% 1.4%<br />
EU 0.7% -3.9% 1.7% 1.8% 1.5%<br />
USA 0.0% -2.6% 2.9% 1.5% 1.5%<br />
Japan -1.2% -6.3% 4.0% -0.8% 2.7%<br />
Brazil 5.2% -0.7% 7.5% 3.9% 3.5%<br />
Russia 5.2% -7.8% 4.0% 4.4% 3.5%<br />
India 4.9% 9.1% 8.8% 8.0% 8.0%<br />
China 9.6% 9.2% 10.3% 9.0% 8.0%<br />
World 2.7% -0.7% 4.9% 3.7% 3.5%<br />
Source: WestLB as of 28/08/2011<br />
The global economic recovery in 2010 has been driven predominantly by<br />
Asian and other emerging countries, in particular China and India. China<br />
grew by 10.3% mainly on the back of domestic economic activity, with strong<br />
investments in the construction and real estate market. India grew at a rate of<br />
8.8%, mainly driven by private consumption. Due to the higher base, the year<br />
2011 should see as slower but still solid growth in global GDP and the<br />
emerging markets are expected to continue underpinning global growth, with<br />
China and India still showing high single digit growth rates. Within Europe,<br />
Germany follows-up on its leading role, in particular on the base of its strong<br />
exports. France is gaining speed in 2011 after a rather moderate development<br />
2006<br />
2007<br />
2008<br />
2009<br />
Total Sales Growth (r.s.)<br />
2010<br />
2011E<br />
50%<br />
40%<br />
30%<br />
20%<br />
10%<br />
0%
<strong>ISRA</strong> <strong>VISION</strong> In-Depth Report<br />
2012 should still see<br />
solid growth, despite<br />
weaker situation in some<br />
countries<br />
European machine<br />
vision market increased<br />
by 34.8% in 2010<br />
Germany most<br />
important market<br />
- 12 -<br />
in 2010. Italy remains weak, mainly as a result of sluggish private and public<br />
consumption. In Spain, the restrictive fiscal policy along with the lasting crisis<br />
in the real estate and banking sectors weigh on the recovery. The UK is also<br />
losing ground, in particular because of fiscal measures such as the VAT<br />
increase in order to reduce the national budget deficit. The US has recovered<br />
by 2.7% in 2010 on the back of a number of governmental stimulus packages.<br />
Due the current debt crisis, the country is expected to show weaker rates in<br />
2011 and 2012. With a 4% GDP growth, Japan has seen a strong recovery in<br />
2010, the current year will, however, be burdened by the tragic events in<br />
Fukushima.<br />
For 2012, a variety of indicators point at a major slowdown in economic<br />
growth and equity markets have already reacted quite heavily on such<br />
prospects. In fact, economic forecasts for a number of countries have been<br />
lowered. Still, India and China should not fall materially short of 2011, Italy<br />
and the UK should finally see some acceleration and the US is not going<br />
down further from the 2011 level. Against this background, we should still<br />
see solid single-digit global GDP growth, which is even ahead of the 2008<br />
level. Within Europe, Germany is expected to defend its leading role.<br />
Sales distribution and growth rates by region<br />
400<br />
350<br />
300<br />
250<br />
200<br />
150<br />
100<br />
50<br />
0<br />
Germany<br />
France<br />
Italy<br />
UK & Ireland<br />
Other Europe<br />
2009 2010 Growth (r.s.)<br />
Source: EMVA, sales of surveyed companies in EURm<br />
Americas<br />
160%<br />
140%<br />
120%<br />
100%<br />
80%<br />
60%<br />
40%<br />
20%<br />
0%<br />
Based on the sound economic recovery the European machine vision market<br />
has recovered much faster from the crisis in 2009 than most of the<br />
companies had anticipated. While the industry expected at the beginning of<br />
2010 to raise sales by 10%, a level of 35% was finally achieved, according to a<br />
survey of 225 European machine vision companies undertaken by the<br />
EMVA. It should be highlighted that roughly half of the companies included<br />
in that report are based in Germany and that these companies account for<br />
61% of the reported sales. Germany is thus playing an exceptional role in that<br />
survey.<br />
Looking at the results of the EMVA survey shows that not only 61% of the<br />
sales of European machine vision companies were generated by machine<br />
vision companies located in Germany, 32% of sales are also generated from<br />
German customers. Germany is thus the largest market for European<br />
machine vision companies. With a share of 8% the Italian market has<br />
replaced France as the second most important European machine vision<br />
market. In total, 72% of sales of the European companies are generated<br />
within Europe. Just over 13% go to each, the Americas and Asia.<br />
China<br />
Japan<br />
South Korea<br />
Other Asia<br />
Other World
<strong>ISRA</strong> <strong>VISION</strong> In-Depth Report<br />
China driving growth<br />
Economic development<br />
should fuel growth in<br />
the machine vision<br />
industry further. German<br />
companies excellently<br />
positioned<br />
Automotive and<br />
Electrical show strongest<br />
growth rates in 2010<br />
- 13 -<br />
In terms of growth, Asia (+62%) is even outpacing North America (which<br />
already grew at a remarkable rate of 46%) mainly driven by China (+151%),<br />
which reinforced its position as the most important Asian market for<br />
European machine vision companies. Though much smaller markets, Taiwan<br />
(132%) and South Korea (62%) also showed unmatched growth rates. It is<br />
also noteworthy that these extraordinarily high growth rates are mainly a<br />
result of the excellent links of German companies to these countries.<br />
Excluding the German companies from the survey, shows much more<br />
balanced growth among the Asian countries. With 28%, Europe grew underproportionately,<br />
with the important German and French markets being up<br />
“just” 24.8% and 19.7%, respectively.<br />
Though at a lower rate than previously anticipated, the global economy is<br />
expected to grow further in the coming years, predominantly driven by a<br />
number of Asian countries. This should stimulate the development of the<br />
machine vision industry further. Against this background, German machine<br />
vision companies appear to enjoy a rather favourable position within the<br />
European landscape as they can tap the largest home market, benefit from<br />
the above average economic development of Germany compared to the<br />
other European countries and have excellent relations to the highest growth<br />
regions.<br />
REVIVAL OF TRADITIONAL CUSTOMER INDUSTRIES<br />
Looking at customer industries, we find that demand from the traditional<br />
industrial customers sharply increased in 2010 as a result of the economic<br />
upswing and accounted for 90% of total sales. Here the largest customer<br />
sector, the automotive industry, saw the strongest increase (61%). Packaging,<br />
the second most important customer group, grew roughly in line with the<br />
market and thus maintained its market share. On the base of an 82% jump in<br />
sales, the electrical/electronic industry has become the third largest customer<br />
group for European machine vision companies. Also the medical and<br />
pharmaceutical customers showed a strong upswing in their ordering activity.<br />
In contrast, we still saw negative growth rates in food, semiconductors and<br />
other manufacturing. Though the non-manufacturing customers show a<br />
lower percentage of total sales in 2010 they have not declined in absolute<br />
numbers and continue to represent an important and further growing part of<br />
the market.<br />
Market shares and growth rates by customer industry<br />
25%<br />
20%<br />
15%<br />
10%<br />
5%<br />
0%<br />
Source: EMVA<br />
Automotive<br />
Packaging<br />
Electrical<br />
Pharma<br />
Glass<br />
Paper<br />
Metal<br />
Rubber/Plastic<br />
Semiconductors<br />
Medical<br />
Printing<br />
Food<br />
Other Manuf.<br />
2009 2010 Growth (r.s.)<br />
Non Manuf.<br />
120%<br />
80%<br />
40%<br />
0%<br />
-40%<br />
-80%
<strong>ISRA</strong> <strong>VISION</strong> In-Depth Report<br />
Automotive still on the<br />
expansion trail<br />
Glass market to show<br />
more moderate growth<br />
Metal benefiting from<br />
relocation of capacities<br />
Paper and pulp still off<br />
peak levels<br />
Pharma shows high<br />
growth from BRIC<br />
countries and new<br />
regulatory requirements<br />
Semiconductors growing<br />
at solid rate again<br />
- 14 -<br />
Going forward we see the automotive industry taking the dynamic<br />
development, which was predominantly driven by the four BRIC countries as<br />
well as the US market, into 2011 and (to a slightly lesser extent) 2012, though<br />
some European markets have cooled down somewhat. Investment spending<br />
appears to continue, mainly in order to serve upcoming demand in Asia, in<br />
particular China.<br />
In the flat glass industry, China accounts for approximately 50% of global flat<br />
glass production, followed by Europe (16% in 2009) and the US (8% in<br />
2009). In 2010, sales showed declines in some instances in building products,<br />
automotive as well as speciality glass. In 2011, the building sector now shows<br />
a return to modest growth, the solar business is expected to continue growing<br />
as are the automotive (see above) and display businesses. In fact, the glass<br />
market is expected to grow on average by 6% through 2014. However, 2012<br />
might be slightly below that rate and the industry might not come back to<br />
pre-crisis production levels before 2013. We would thus expect to see<br />
investments in machine vision systems rather as a result of productivity<br />
measures than further capacity expansions.<br />
The metal industry showed double-digit growth rates in all steel producing<br />
countries in 2010. Aluminium production increased mainly as a result of new<br />
smelters started and restarted, in particular in China but also Qatar and the<br />
UAE. Copper production remained roughly stable. Going forward,<br />
production might fall back again, leading to a lower utilisation of capacities.<br />
Still, there is a trend to relocate capacities to higher growth regions, which<br />
should be favourable for machine vision companies.<br />
The production of paper and pulp has recovered to some extent from the<br />
dramatic decline in 2009 but is still 8-10% short of the pre-crisis levels. The<br />
year 2011 is expected to show further progress in a mid-single digit rate. The<br />
industry should thus see its pre-crisis levels by 2012/13. Going forward, we<br />
would thus expect investment activity to accelerate moderately.<br />
The world pharmaceutical market was worth an estimated EUR597bn in<br />
2010, with North America accounting for a 42% share, well ahead of Europe<br />
(29%) and Japan (11%). Rapid growth is experienced in particular in<br />
emerging economies such as Brazil, China and India. China and Brazil<br />
showed growth rates of more than 20% compared with an average rate of<br />
1.8% in the five major European markets and 3.3% for the US market.<br />
Increasing regulatory requirements in many countries that aim at securing<br />
drug safety despite increasingly globalized supply chains should additionally<br />
fuel investment spending in track and tracing solutions. The European<br />
Parliament, for example, has adopted a directive against falsified medicine in<br />
February 2011, which must be implemented into national law until 2013.<br />
In the semiconductor industry, all major product categories showed doubledigit<br />
growth rates in 2010. With a 31.8% increase compared to the crisis year<br />
2009, the industry recorded a record number of global chip sales last year.<br />
With 54% of sales the Asia/Pacific region is the largest market for<br />
semiconductors. For 2011, a moderate single digit growth is expected, though<br />
the year has started with double-digit growth. Silicon wafers showed a slightly<br />
lower growth (45%) compared to chips in 2010 so that solid demand (at a<br />
more modest post-recovery rate) is expected for 2011. The global electric and<br />
electronic industry followed the recovery of the semiconductor and silicon<br />
wafer industry in 2010 and has compensated the losses during the global<br />
crisis within a year. For 2011, the world market is expected to grow by 7%,<br />
with the most dynamic development in the emerging markets. 2012 should<br />
come in slightly below this rate.
<strong>ISRA</strong> <strong>VISION</strong> In-Depth Report<br />
Automotive, electrical<br />
and pharma could<br />
become main drivers of<br />
future growth, German<br />
companies show strong<br />
positioning in these<br />
industries<br />
Inspections systems for<br />
discrete items still the<br />
most important<br />
application<br />
Different products used<br />
for different fields of<br />
application<br />
Symbol reading and<br />
discrete inspection show<br />
highest growth rates in<br />
2010<br />
- 15 -<br />
On the back of current market developments at the major customers we<br />
would expect further growth for the European machine vision industry to be<br />
fuelled in particular from the important segments, automotive and electrical,<br />
but also pharma and medical. Looking at the German machine vision<br />
companies, we find them over-proportionately strong positioned in particular<br />
in the automotive but also the pharma industries, which should give them an<br />
edge over their European competitors. It should also be noted that some<br />
machine vision companies are able to generate high growth in industries that<br />
are growing more moderately as a result of for example their market<br />
positioning or their product offering.<br />
DISCRETE INSPECTION SYSTEMS REMAIN KEY APPLICATION<br />
The applications of machine vision technology are as multifaceted as the<br />
customer industries that use them. The most important applications can be<br />
found in inspection, i.e. the inspection of discrete items and the inspection of<br />
continuous materials, such as paper, plastic films or sheet metal, also known<br />
as “web inspection”. Discrete systems accounted for 46.5% of all vision<br />
applications in 2010. Together, both applications came to 59.5%. Metrology<br />
is the second most important field of application. Here 3D metrology alone<br />
accounts for 13% out of a total of 16%.<br />
Separating the two product categories of vision systems, we find that the<br />
distribution of applications varies significantly. Inspection systems are clearly<br />
the most important application for more sophisticated application-specific<br />
and configurable systems. Compact systems, such as smart cameras and<br />
vision sensors, are more often used in metrology as well as in character<br />
recognition, part recognition and symbol reading.<br />
In terms of growth, we find the highest rate (49%) in symbol reading, i.e. bar<br />
codes & dot-matrix codes. Growth here is particularly driven by the<br />
industries’ increased efforts to make their supply and value added chains<br />
consistently traceable. Given that regulations across the globe increasingly<br />
require this, we expect their growth to remain above average. Discrete<br />
inspection systems and 2D metrology also grew over-proportionately in 2010.<br />
The strong development of others, might point at strong innovation, though<br />
areas widely related to inspection or measuring tasks might be included in<br />
here.<br />
Market shares and growth rates by applications<br />
60%<br />
50%<br />
40%<br />
30%<br />
20%<br />
10%<br />
0%<br />
Source: EMVA<br />
Inspection<br />
(discrete)<br />
Inspection<br />
(continuous)<br />
Metrology<br />
Symbol<br />
reading<br />
Guidance<br />
Character<br />
recognition<br />
Part<br />
recognition<br />
2009 2010 Growth (r.s.)<br />
Other<br />
200%<br />
150%<br />
100%<br />
50%<br />
0%<br />
-50%<br />
-100%
<strong>ISRA</strong> <strong>VISION</strong> In-Depth Report<br />
Discrete inspection<br />
systems, 3D systems and<br />
new applications to drive<br />
future growth<br />
Systems vs. components<br />
Vision systems still the<br />
most important product<br />
category …<br />
… but cameras and<br />
compact systems show<br />
the highest growth rates<br />
Sales growth mainly<br />
driven by higher<br />
volumes<br />
Falling prices help<br />
fuelling further growth<br />
- 16 -<br />
On the back of over-proportionate growth expectations coming from the<br />
automotive and pharma industries, we would expect discrete inspection<br />
systems to continue growing above average in the coming years. Moreover,<br />
3D systems should gain pace again, and we would expect the number of new<br />
application types to increase further. Interestingly, the German companies are<br />
less well positioned in discrete inspection systems compared to the European<br />
average, despite their strong links to the automotive and pharma industries.<br />
They are, however, stronger in continuous processes.<br />
TREND TOWARDS LESS COMPLEX PRODUCTS<br />
Machine vision technology can be separated in two main categories, i.e. vision<br />
systems and vision components. Vision systems cover the above mentioned<br />
application-specific visions systems and configurable vision systems, as well<br />
as smart cameras/compact systems and vision sensors. Vision components<br />
include cameras, frame grabbers, lighting equipment, optics, vision software,<br />
interfaces and cables, as well as other vision accessories.<br />
The following chart shows that vision systems are still the most important<br />
product category, accounting for 42.7% of sales in 2010. Including compact<br />
systems, the share of systems comes to 50.7%. The sale of components<br />
accounts for the remaining half of the market, with cameras being by far the<br />
most important component (30.7%).<br />
Cameras and compact systems showed the highest growth rates, with 61%<br />
and 49%, respectively. With components (+50.5%) clearly outpacing systems<br />
(+23.7%) there appears to be a trend towards lower value products. This is<br />
also reflected in the systems segment, where compact systems grew more<br />
than twice as fast compared to their more complex counterparts in 2010.<br />
Sales and growth rates by product type<br />
700<br />
600<br />
500<br />
400<br />
300<br />
200<br />
100<br />
0<br />
Vision<br />
systems<br />
Compact<br />
systems<br />
Cameras<br />
Frame<br />
Grabbers<br />
2009 2010 Growth<br />
Source: EMVA, sales of surveyed companies in EURm<br />
Lighting<br />
The following chart makes it clear that the sales trends described above<br />
mainly follow the unit developments as price changes accounted for just 4-6<br />
percentage points. In fact, averages prices were down between 4.0% and<br />
5.5% for vision systems, compact systems and cameras, while price for frame<br />
grabbers and Optics increased by 6.3% and 4.1%, respectively.<br />
The graph also illustrates the huge pricing difference between vision systems<br />
and the other product, which fall into a range of EUR130 to EUR1300<br />
compared EUR23000 for an average vision system. As a general trend, we see<br />
Optics<br />
Vision<br />
Software<br />
Interfaces<br />
and cables<br />
Other<br />
Asseccories<br />
70%<br />
60%<br />
50%<br />
40%<br />
30%<br />
20%<br />
10%<br />
0%
<strong>ISRA</strong> <strong>VISION</strong> In-Depth Report<br />
Future growth at<br />
compact systems and<br />
components driven by<br />
new application and<br />
greater ease of use<br />
Increasing share of endusers<br />
- 17 -<br />
key products becoming less expensive, while performance is further<br />
increasing. This is an additional driver of volume growth.<br />
Average prices of major products<br />
40.000<br />
35.000<br />
30.000<br />
25.000<br />
20.000<br />
15.000<br />
10.000<br />
5.000<br />
0<br />
2009<br />
Source: EMVA, in EUR<br />
2010 Growth<br />
Though complex vision systems will remain an indispensible part of the<br />
machine vision industry and the strong development of the automotive<br />
industry will continue to support growth here, we see a trend towards<br />
compact systems and single components, in particular cameras. This is in our<br />
view driven by an increasing use in new field of application such as traffic<br />
control or security as well as in increasing ease of use of machine vision<br />
technology, allowing the customers to use the tools by themselves.<br />
Market shares by customer type<br />
60%<br />
50%<br />
40%<br />
30%<br />
20%<br />
10%<br />
0%<br />
Source: EMVA<br />
Vision<br />
systems<br />
OEM<br />
Compact<br />
systems<br />
End-users<br />
Cameras<br />
Integrators<br />
Frame<br />
Grabbers<br />
8%<br />
6%<br />
4%<br />
2%<br />
0%<br />
-2%<br />
-4%<br />
-6%<br />
-8%<br />
The latter trend can be observed in the development of market shares of the<br />
different customer types. In 2010 end-users became again the strongest<br />
customer type, accounting for 55% of sales. This back-shift to end-users<br />
could also be observed in Germany, where end-users now accounted for 47%<br />
of sales, and was even more pronounced in the other European countries.<br />
The decline in OEM equipment is to a large extent a reflection of the<br />
introduction of a new category, integrators.<br />
Distributors<br />
2009 2010<br />
Optics<br />
Others
<strong>ISRA</strong> <strong>VISION</strong> In-Depth Report<br />
Positive impetus from<br />
traditional industries and<br />
new applications<br />
Emerging countries on<br />
the move, America to<br />
increase level of<br />
automation, Germany<br />
with strong economic<br />
development<br />
Products becoming<br />
more powerful at lower<br />
prices<br />
European machine<br />
vision market expected<br />
to show 20% growth in<br />
2011<br />
- 18 -<br />
NUMEROUS DRIVERS OF FUTURE GROWTH<br />
In total, the remarkable upswing in the automotive industry with a sharp rise<br />
of demand in Asian countries, together with industries resilient to economic<br />
fluctuations such as the pharma industry should ensure that the traditional<br />
customer industries will remain the backbone of vision technology companies<br />
in Europe. Moreover, turnover in the non-manufacturing sectors, such as life<br />
science, security, medical equipment, entertainment and traffic, should gather<br />
speed again.<br />
Above all, Chinese manufacturers are increasingly automating their<br />
production as demands for quality are rising in not only their export but also<br />
the domestic markets. Car manufacturers in China are considerably<br />
expanding their capacities. Other industries follow suit. Other Asian markets<br />
such as South Korea, Thailand and Malaysia offer potential for increases in<br />
turnover. The level of automation is rather low in growth regions such as<br />
Brazil. Also the American market still has a low level of automation and<br />
needs to improve productivity. In Europe, growth should be driven by the<br />
Central and Eastern European countries. Though Germany ranks second in<br />
terms of automation after Japan, the positive economic situation of the<br />
country should drive growth here.<br />
These developments are supported by the fact that products are getting<br />
cheaper, more standardized, easier to use and more powerful. The latter<br />
involves a continuous improvement of all vision systems components.<br />
Computer-related developments that have particularly increased the<br />
performance and applicability of machine vision systems are faster processors<br />
and bus speeds, as well as the miniaturization of chips. Camera-related<br />
developments include a trend toward increasing resolutions and the<br />
introduction of faster sensor frame rates. Connection-related developments<br />
have led to faster, digital interfaces, which are able to manage the higher<br />
bandwidth signals generated by faster sensor frame rates and greater<br />
resolution. Software-related developments are new or improved algorithms<br />
and easier to use interfaces. The latter has particularly increased the<br />
acceptance of machine vision systems on the factory floor. The impact of the<br />
technological progress is two-fold: first, the efficiency of vision systems is<br />
increasing continuously; making their use even more profitable for end users<br />
and second, new fields of application are opening up.<br />
Against this background, the EMVA expects the machine vision industry to<br />
grow by 20% in 2011. In contrast to 2010, Europe is expected to show the<br />
highest growth rate with 22%. The Americas should come to 19% and Asia,<br />
mainly driven by China to 18%. The German industry association expects an<br />
increase of 11% for its members, however, in view of recent trading this<br />
appears to be more than conservative. The year 2012 should then show a<br />
more normalised rate. As a result of the late cyclical nature of the industry,<br />
some slowdown of economic growth expected for 2012 should rather be felt<br />
in subsequent years.
<strong>ISRA</strong> <strong>VISION</strong> In-Depth Report<br />
Further consolidation<br />
likely to be an additional<br />
source of growth<br />
- 19 -<br />
Outlook for the MV market by region<br />
70%<br />
60%<br />
50%<br />
40%<br />
30%<br />
20%<br />
10%<br />
0%<br />
-10%<br />
-20%<br />
-30%<br />
Source: EMVA<br />
Europe<br />
An additional source of growth is the hugely fragmented market structure.<br />
The following chart shows that almost half of the surveyed companies have<br />
only between 1 and 10 employees. Only 4% of the companies have more<br />
than 100 employees. This leaves ample room for further consolidation, which<br />
should take place for three reasons: (1) end users of machine vision tend to<br />
be global manufacturers which prefer companies that can service them in<br />
different countries, (2) price pressure in the industry is particularly hard for<br />
smaller companies with less bargaining power and (3) the substitution of less<br />
complicated machine vision application-specific vision systems by ‘off the<br />
shelf’ solutions should particularly hit smaller providers with a limited<br />
number of products on offer. Larger players should thus profit from the<br />
continued consolidation of the market.<br />
European machine vision companies by size<br />
18%<br />
Source: EMVA, no of employees<br />
America<br />
Asia<br />
Other<br />
2009 2010 2011E<br />
20%<br />
9%<br />
4%<br />
49%<br />
1-10 11-20 21-50 51-100 101-500<br />
Total
<strong>ISRA</strong> <strong>VISION</strong> In-Depth Report<br />
COMPANY PROFILE AND STRATEGY<br />
Global player with …<br />
… strong positions in<br />
key growth regions<br />
- 20 -<br />
STRONGLY POSITIONED IN KEY GROWTH REGIONS<br />
<strong>ISRA</strong> Vision is one of the leading providers for machine vision systems. The<br />
company was founded in 1985 and has its headquarters in Darmstadt,<br />
Germany. In total, the company has more than 20 subsidiaries, of which 11<br />
are located in Europe (Germany 7, UK 2, Finland 1 and Italy 1), 7 in Asia<br />
(including two in China and one in India), 2 in North America and 1 in South<br />
America (Brazil). The latest addition is the glass centre in Tianjin, China.<br />
<strong>ISRA</strong> plans to open another subsidiary in Moscow soon. The company<br />
employs nearly 440 people. With approximately 40 employees, China has<br />
turned into <strong>ISRA</strong>’s second largest location after Germany.<br />
<strong>ISRA</strong>’s international structures are reflected in its composition of sales.<br />
Though Europe is still the most important market for the company with a<br />
sales share of 42%, Asia’s importance has increased significantly over the<br />
recent years, now accounting for approx. 38% of total sales. Overseas sales in<br />
total already account for more than half of the business. This is a significantly<br />
higher exposure to key growth regions compared to the market average<br />
(North America 12% and Asia 16%). Though the European market is<br />
expected to show a slightly higher growth rate in 2011, we would expect the<br />
overseas share to increase further over the medium term. It should also be<br />
noted that last year half of the European sales came from Germany, and half<br />
of the Asia/ROW sales came from China, which both currently offer the<br />
most interesting prospects in their respective regions.<br />
Revenue composition by regions<br />
38%<br />
Source: <strong>MATELAN</strong>, FY2010/11e<br />
20%<br />
42%<br />
Europe America Asia / ROW
<strong>ISRA</strong> <strong>VISION</strong> In-Depth Report<br />
Global presence gives<br />
competitive advantage<br />
Expansion increased<br />
importance of surface<br />
vision<br />
Metal, glass and plastics<br />
have become <strong>ISRA</strong>’s<br />
most important<br />
segments<br />
- 21 -<br />
Basically there are four advantages arising from <strong>ISRA</strong>’s above average size<br />
and its higher degree of internationalisation compared to most machine<br />
vision companies. Firstly, development costs as percentage of total sales are<br />
lower, which facilitates investment in R&D. Secondly, services can be offered<br />
across the globe which is important as most manufacturer operate globally.<br />
Then, production re-allocation trends – such as the move of the solar<br />
industry to Asia can be followed and finally, the negotiation power towards<br />
suppliers is better, though <strong>ISRA</strong>’s size compared to its end customers is still<br />
small (which shows in still rather high receivables outstanding).<br />
BROAD DIVERSIFICATION ACROSS INDUSTRIES<br />
Within its organization, <strong>ISRA</strong> distinguishes between two segments: industrial<br />
automation and surface vision. The company’s structure is illustrated in the<br />
graph below. The first segment – industrial automation - encompasses <strong>ISRA</strong>’s<br />
robot guidance and quality vision applications. Having refrained from<br />
offering applications for the logistics and food industries where margins tend<br />
to be lower, the segment is now focused on the automotive industry, which<br />
used to be <strong>ISRA</strong>’s dominant activity before the company started the<br />
systematic expansion of its second segment, surface vision, over the past ten<br />
years. With a sales share of approximately 85%, surface vision today is clearly<br />
the most important segment. It encompasses seven industries for which<br />
<strong>ISRA</strong> is offering surface inspection systems at various points in their<br />
production processes.<br />
Company structure<br />
Indust.<br />
Autom.<br />
Automotive<br />
Glass<br />
Source: <strong>ISRA</strong> <strong>VISION</strong><br />
Solar<br />
Plastics<br />
Surface<br />
Vision<br />
With a sales share of about 21% each, we expect the glass and the metal<br />
industry to be <strong>ISRA</strong>’s most important customer groups followed by the<br />
plastics industry, the automotive industry, the paper industry, the solar<br />
industry and the print industry. The solar segment is <strong>ISRA</strong>’s most recently<br />
formed business segment. It includes <strong>ISRA</strong>’s inspection applications for thinfilm<br />
solar modules, for solar parabolic mirrors as well as for Si-solar cells and<br />
modules. The latter encompasses the applications of Graphikon, which <strong>ISRA</strong><br />
acquired last year.<br />
Print<br />
Specialty Paper<br />
Paper<br />
Metal
<strong>ISRA</strong> <strong>VISION</strong> In-Depth Report<br />
Strongly diversified<br />
industry presence<br />
Crisis has given<br />
consolidation a further<br />
push<br />
Cognex is still <strong>ISRA</strong>’s<br />
main competitor<br />
- 22 -<br />
Revenue composition by customer industry<br />
13%<br />
15%<br />
8%<br />
Source: <strong>MATELAN</strong> estimates, FY 2010/11e<br />
16%<br />
We had already pointed out that the industry outlook in segments such as<br />
metal and glass is slightly less favourable compared to automotive or<br />
electronics. <strong>ISRA</strong> is, however, performing excellently in these areas, which<br />
might be a reflection of the company’s global presence, allowing it to follow<br />
customers when re-locating capacities around the globe, and its strong market<br />
position in these segments, allowing it to beat the competition. Moreover, the<br />
strongly performing automotive industry still plays an important role for<br />
<strong>ISRA</strong> and with the acquisition of Graphikon, <strong>ISRA</strong> has now a solid exposure<br />
to the strongly growing solar industry. Overall, with its broad and rather<br />
balanced industry mix we see <strong>ISRA</strong> well positioned to benefit from market<br />
growth and somewhat protected against an economic downturn as the<br />
different industries react a different points in time.<br />
DIFFERENTIATING FROM THE COMPETITION<br />
6%<br />
The global economic crisis left its traces in the competitive landscape of the<br />
machine vision markets. Particularly smaller companies were hit hard and the<br />
market has experienced an increase in consolidation as some companies went<br />
bankrupt, withdrew from market segments, or were taken over by larger<br />
competitors. Some of the smaller companies are still struggling for survival.<br />
With only limited funds left for the development and marketing of new<br />
products, they mainly cause pressure on prices for older and less<br />
sophisticated vision applications.<br />
The following table shows <strong>ISRA</strong>’s main competitors in the relevant markets.<br />
From this, it becomes clear that Cognex remains <strong>ISRA</strong>’s number one<br />
competitor, addressing five of <strong>ISRA</strong>’s seven target markets. Competition of<br />
the other companies confines to just one or two market segments.<br />
21%<br />
21%<br />
Metal Glass Plastics Automotive Paper Solar Print
<strong>ISRA</strong> <strong>VISION</strong> In-Depth Report<br />
Automotive Industry:<br />
� Smaller companies<br />
compete on prices<br />
� Cognex offers simple,<br />
Perceptron more<br />
complex systems<br />
� <strong>ISRA</strong>’s focus on<br />
complex 3D system<br />
seems to pay off<br />
� Tackling Cognex with<br />
new products<br />
- 23 -<br />
Main competitors in <strong>ISRA</strong>’s market segments<br />
Indust.<br />
Autom.<br />
Automotive<br />
Perceptron<br />
Cognex<br />
HGV<br />
VMT<br />
Quiss<br />
Inos<br />
Glass<br />
Dr. Schenk<br />
Takano<br />
Kubotech<br />
Orbotech<br />
Metal<br />
Cognex<br />
VAI<br />
Source: <strong>ISRA</strong> <strong>VISION</strong>, <strong>MATELAN</strong> <strong>Research</strong><br />
Plastics<br />
Cognex<br />
Electr. Sys.<br />
Futec<br />
OCS<br />
Surface<br />
Vision<br />
Paper<br />
ABB<br />
Measurex<br />
Cognex<br />
Futec<br />
In the automotive industry, <strong>ISRA</strong> competes in particular with Cognex,<br />
Perceptron, VMT, HGV, Inos and Quiss. While Cognex and Perceptron<br />
compete against <strong>ISRA</strong> on a global basis, VMT, HGV, Inos and Quiss are<br />
local players in Europe. Their limited size and lower global reach made them<br />
more crises prone and they compete currently rather on prices than new<br />
product developments.<br />
Cognex offers less specialized systems for robot guidance and quality control,<br />
which can be either customized by system integrators or – because of their<br />
improved ease of use – by end users themselves. Perceptron, on the other<br />
hand is specialized on more complex three-dimensional applications. The<br />
company’s unique selling proposition was its application for three<br />
dimensional gauging which allows car manufacturers to compare the<br />
digitalized manufactured parts with their CAD master. As opposed to <strong>ISRA</strong>’s<br />
solutions, Perceptron’s applications base on laser technology, which is the<br />
most common technique for 3D scanning. <strong>ISRA</strong> has a broader portfolio of<br />
quality assurance and robot guidance applications along the whole production<br />
line.<br />
With price competition for the more simple applications increasing, <strong>ISRA</strong> has<br />
stopped marketing these applications actively and is more concentrating on<br />
the more complex, particularly three dimensional applications, which are<br />
more interesting from a margin perspective. Most recently, <strong>ISRA</strong> has<br />
managed to win a larger (‘in the double-digit million Euro range’) long-term<br />
framework contract for the supply of three-dimensional applications to a<br />
Southern German car manufacturer. According to mgmt, this contract<br />
includes the supply of three dimensional car-body gauging, which is based on<br />
<strong>ISRA</strong>’s digital image processing technology and - just like Perceptron’s -<br />
allows car manufacturers to make the critical CAD comparison. <strong>ISRA</strong> uses its<br />
two own sensors for this, which include a digital camera and a projector. The<br />
software used was developed by Metronom, a company which <strong>ISRA</strong> had<br />
taken over a few years ago just for this reason. We expect that <strong>ISRA</strong> will use<br />
this first marketing success as entry ticket to win further customers and thus<br />
tackle Perceptron on this side.<br />
In addition, mgmt has announced that from FY2011/12 onwards it will offer<br />
four ‘ready to use’ 3D applications for simpler tasks, which include a selfdeveloped<br />
sensor as well as the software. These will compete against<br />
Cognex’s applications and it will be interesting to see if <strong>ISRA</strong> will be able to<br />
Solar<br />
Dr. Schenk<br />
Cognex<br />
ATM Vision<br />
GP Solar<br />
KLA<br />
Tecnor<br />
Intego<br />
Vitronic<br />
Print<br />
AVT<br />
BST<br />
Eltromat
<strong>ISRA</strong> <strong>VISION</strong> In-Depth Report<br />
Glass inspection:<br />
�More than 80%<br />
market share<br />
� Competing on size,<br />
global presence and<br />
technology<br />
Metal industry:<br />
� Market leader in<br />
metal inspection<br />
Plastics industry:<br />
� Focus on new<br />
production processes<br />
drives growth<br />
Paper industry:<br />
� Technological<br />
leadership<br />
- 24 -<br />
tackle Cognex’ core competence. What improves <strong>ISRA</strong>’s chances on this side<br />
is that – as explained in some more details in the chapter in product<br />
development – a long-term key manager of Cognex is responsible for the<br />
development and marketing of these products.<br />
In glass inspection, <strong>ISRA</strong> has managed – both via organic growth and several<br />
acquisitions – to become the most dominant player in the market. <strong>ISRA</strong>’s<br />
management estimates its market share in glass inspection to be more than<br />
80%. As opposed to its competitors, <strong>ISRA</strong> offers inspection solutions for<br />
different glass production methods (i.e. float and draw glass) and inspection<br />
solutions for subsequent processing such as insulation and coating designed<br />
for different purposes including automotive glass, architectural glass, glass for<br />
flat panel displays and solar glass.<br />
Among the competitors, Munich based Dr. Schenk is the closest, also<br />
offering a broad portfolio of applications. <strong>ISRA</strong>’s main advantage here is size<br />
and a higher degree of internationalisation. The other competitors, i.e. Basler,<br />
Kubotech and Takano are specialized on different processing steps in the<br />
FDP glass production and thus only have a marginal overlap in their field of<br />
activity with <strong>ISRA</strong>. Compared to all competitors in glass inspection one of<br />
<strong>ISRA</strong>’s competitive advantages is its patent for the Moiré technology, which<br />
is vital for checking distortions in glass.<br />
Also in the market for metal inspection, <strong>ISRA</strong> has a dominant position with a<br />
current market share of about 65% (based on the inspection tasks it<br />
provides). <strong>ISRA</strong>’s applications in this field are mainly enhancements of<br />
Parystec’s inspection systems. Particularly the customisation time of<br />
Parsytec’s applications were reduced. The main competitive advantage here is<br />
the technological leadership in complex inspection tasks, particularly<br />
inspection in the early stages of production on rough materials and under<br />
difficult environmental conditions. With a market share of approx. 26%,<br />
Cognex is the number two in the metal market. Cognex is more specialized in<br />
simpler systems. Number three in this market is SiemensVAI, which provides<br />
engineering and plant-building services to the metal industry and thus has the<br />
advantage of being integrated in investment decisions right from their start.<br />
In the plastics industry, <strong>ISRA</strong>’s competitors apart from Cognex are Futec,<br />
Electronic Systems, and OCS. Having started to penetrate the market earliest,<br />
Cognex has the largest market share in the non-woven industry. All others are<br />
local players, among which the Japanese company Futec is the largest player<br />
with a particularly good position in its home market. While, Futec has no<br />
technological advantage, it is quite price aggressive in order to defend its<br />
positioning in Asia. <strong>ISRA</strong>’s plastics segment, nevertheless, has been one of<br />
the company’s main growth drivers in the past couple of quarters, which was<br />
achieved mainly by addressing production processes of newly invented<br />
products. Among other things, <strong>ISRA</strong> has sold its inspection solutions for the<br />
production of films for touchscreen panels and Li-ion batteries. <strong>ISRA</strong>’s<br />
market share in the inspection of plastics is approx. 35% with regard to the<br />
applications it regards as interesting.<br />
In the inspection of paper production, <strong>ISRA</strong> competes in particular with<br />
ABB, Cognex and Futec. Behind ABB, <strong>ISRA</strong> is number two in this segment<br />
with a market share of approximately 25%. ABB’s main competitive<br />
advantage is that it offers inspection solutions as an add-on tool to its<br />
production equipment. As an equipment provider, ABB is involved in the<br />
investment process right from the start. Something similar applies to Cognex<br />
that mainly acts as OEM partner to Honeywell/Measurex. <strong>ISRA</strong>’s systems,<br />
which consist of a fusion of <strong>ISRA</strong>’s and Parsytec’s technologies, are regarded<br />
to be technologically the most advanced. By recently taking on board the<br />
founders of bankrupt competitor Viconsys <strong>ISRA</strong> was able to add further
<strong>ISRA</strong> <strong>VISION</strong> In-Depth Report<br />
� Developing<br />
interesting niches<br />
Solar Industry:<br />
� Graphikon<br />
acquisition improves<br />
competitive position<br />
Printing industry:<br />
� Still a small player<br />
Applications for robot<br />
guidance, surface vision<br />
and quality vision<br />
Industrial automation<br />
mainly focuses on threedimensional<br />
robot vision<br />
applications<br />
Breakthrough in 3D<br />
applications<br />
- 25 -<br />
applications to its paper portfolio and further expand its customer base. As in<br />
plastics, Futec’s competition is limited to Asia and again mostly is via prices.<br />
None of the larger players is active in the segment ‘specialty paper’. There<br />
had been a number of smaller players, which went bankrupt in the course of<br />
the global recession. <strong>ISRA</strong> now sees no serious competition in this segment,<br />
which is small but has interesting margins.<br />
In the area of thin-film solar module inspection, <strong>ISRA</strong>’s solutions meet the<br />
competition of Dr. Schenk, in particular. Again, <strong>ISRA</strong>’s main advantage is its<br />
size and the higher degree of internationalisation. In the area of Si-solar cells<br />
and module inspection, the number of competitors is not only relatively high<br />
but a number of larger companies also entered the market by taking over<br />
smaller market specialists (such as KLA Tencor taking over Icos or<br />
Centrotherm acquiring GP solar). <strong>ISRA</strong> entered this market segment via the<br />
acquisition of Graphikon last year and can now offer inspection solutions<br />
along the value chain. Together with Graphikon’s products, <strong>ISRA</strong> also took<br />
over the company’s connections to its German customer base.<br />
In the printing industry, <strong>ISRA</strong>’s main competitors are AVT, BST (which is a<br />
subsidiary of Elexis) and Eltromat. Of all these players, AVT has the most<br />
advanced systems. BST and Eltromat’s systems are less advanced but<br />
cheaper. All of <strong>ISRA</strong>’s competitors have the advantage of long-established<br />
customer links. AVT clearly dominates the market for highly specialized<br />
inspection systems for web-fed presses. <strong>ISRA</strong> has developed some inspection<br />
solutions for sheet-fed presses. However, up to now <strong>ISRA</strong> still is a relative<br />
small player in the market with – according to management - a market share<br />
only approx. 10%. One advantage of <strong>ISRA</strong> is its co-operation with MAN<br />
Roland which offers <strong>ISRA</strong>’s inspection solution as optional feature in its<br />
printing machines.<br />
STRATEGIC EXPANSION OF ACTIVITIES<br />
<strong>ISRA</strong>’s declared core technology is optical image processing of images<br />
captured via one or more digital cameras. The company is convinced that this<br />
technology is most versatile and offers the most cost efficient solutions. The<br />
products can be subsumed into two categories (1.) industrial automation and<br />
(2.) surface inspection technologies. All consist of software and hardware<br />
components. While software is developed in-house in Germany, hardware<br />
are two a large extent standard components. Only components, which are<br />
being regarded as strategically important (such as certain frame grabbers and<br />
vision sensors) are developed and produced in-house. Product assembly is<br />
done in-house on three locations (Germany, China and USA). In total, the<br />
company holds approximately 100 patents on its developments.<br />
In the segment ‘industrial automation’ <strong>ISRA</strong> possesses more than 30<br />
applications. Due to the low margins achievable for vision applications<br />
offered to the logistics and food industry mgmt has refrained from actively<br />
offering such applications and concentrates on the development and<br />
marketing of such applications in the automobile industry which meet<br />
defined margin targets. As mgmt sees the best margin and growth potential in<br />
three-dimensional applications, it is now focusing on the development and<br />
marketing of such applications. Quality assurance applications, which are<br />
simpler and have lower margins, are only offered as an add-on service for<br />
customers.<br />
The company’s 3D applications base on two sensors, which were developed<br />
and are produced in-house. These consist of a smart camera and a projector,<br />
which projects a grid pattern on the object, which is supposed to be
<strong>ISRA</strong> <strong>VISION</strong> In-Depth Report<br />
Developing new markets<br />
with ‘off-the-shelf’ 3D<br />
applications<br />
Continuous expansion<br />
of surface vision<br />
applications<br />
- 26 -<br />
measured. Via the technique of triangulation <strong>ISRA</strong>’s software can then fully<br />
measure these objects in 3D and even enable a comparison with the CAD<br />
master. <strong>ISRA</strong> obtained the critical software for this via the acquisition of<br />
Metronom. <strong>ISRA</strong> is now able to implement 3D measurement without using<br />
laser technology. The large long-term contract with a large Southern German<br />
car manufacturer which includes a supply of this technologies provides it with<br />
the needed seal of operability. Management now wants to use this<br />
breakthrough as a marketing tool and start and intensified global sales.<br />
In addition to the 3D application, which <strong>ISRA</strong> integrates at its customers’<br />
sites, management has declared that it is currently developing four 3D<br />
applications which are ‘ready to use’ and thus need no integration services<br />
from <strong>ISRA</strong> staff. Mgmt thereby wants to profit from both, the perceived high<br />
potential of 3D applications as well as the current trend towards more<br />
compact and easy to integrate products. With this step, mgmt aims at<br />
accelerating its growth path without having to expand the workforce. In a<br />
first step, the company wants to target the following three markets with the<br />
new ‘off the shelf’ products: ‘Automotive’, ‘Electronics’ and ‘General<br />
Manufacturing’. In the medium term, mgmt also wants to expand the offer to<br />
a broader range of industries. What, in our opinion, should increase <strong>ISRA</strong>’s<br />
chance to get a foothold in this market, which is currently being dominated<br />
by Cognex, is that <strong>ISRA</strong> managed to win Eric Ceyrole as head for the<br />
development and marketing of these new products. Eric Ceyrole worked at<br />
Cognex for more than 15 years and in his latest position as Executive Vice<br />
President (from 2006 onwards) was responsible for managing Cognex’s direct<br />
sales organization as well as all of its channel sales worldwide for the<br />
company’s Modular Vision Systems Division.<br />
While a realignment of the industrial automation division is now mgmt’s<br />
focus, the expansion of the surface vision segments has been the focus within<br />
the past ten years. Next to own development activities, <strong>ISRA</strong> made use of<br />
acquisitions of smaller competitors in order to obtain interesting applications<br />
in existing segments and/or obtain new technologies and an entry into new<br />
markets or regions. As the table below shows, six out of the nine companies<br />
acquired within the past ten years, were integrated in one of the surface vision<br />
segments.<br />
Acquisition history since 2001<br />
2001<br />
2010<br />
•INNOMESS (Glass)<br />
•RMV (Strategic hardware components)<br />
•NANOsystems (Plastics)<br />
•LASOR <strong>AG</strong> (Glass)<br />
•Metronom (Industrial Automation)<br />
•Image Automation (Glass)<br />
•Parsytec (Metal, Paper)<br />
•Vistec (Regional expansion into Turkey, middle East)<br />
•Graphikon (Solar)<br />
Source: <strong>MATELAN</strong> <strong>Research</strong>
<strong>ISRA</strong> <strong>VISION</strong> In-Depth Report<br />
Addressing growing solar<br />
market with Graphikon<br />
acquisition<br />
Consolidating the<br />
market further<br />
Good positioned to<br />
benefit from global<br />
growth<br />
15.5% growth in<br />
2010/11 and …<br />
- 27 -<br />
The most recent acquisition was Graphikon, a small Berlin based company<br />
focused on the inspection of the production process of Si-based solar cells<br />
and modules. Following the integration of Graphikon <strong>ISRA</strong> formed the<br />
segment ‘solar’, which is thought to offer an entire spectrum of vision<br />
applications to the solar industry. Next to inspection solutions for the<br />
Si-based solar cell and module production, it encompasses inspection<br />
solutions for the production of thin-film modules as well as inspection<br />
applications for parabolic mirrors for solarthermal powerplants (both were<br />
formerly part of the glass division).<br />
We would expect <strong>ISRA</strong> to grow further through acquisitions. As illustrated,<br />
<strong>ISRA</strong> has a quite successful track record of integrating companies and adding<br />
new markets, new customers, new industries, new regions and new<br />
technologies to its portfolio. We would see for example track and trace<br />
solutions for the pharma industry as an attractive area of expansion due to<br />
the regional growth prospects and upcoming regulatory changes.<br />
CAPITALIZING ON GROWTH TRENDS<br />
In summary, we see <strong>ISRA</strong> excellently positioned to benefit from the current<br />
recovery of the machine vision market and to capitalize on the growth<br />
prospects going forward. The company can tap a strong home base and has<br />
built strategic bridgeheads in the core growth regions worldwide, in particular<br />
the BRIC countries, which already account for a major share of the<br />
company’s business. Moreover, the company has a rather broad exposure to<br />
different customer industries, which protects it to some extent against cyclical<br />
fluctuations. In some of these industries such as metal and glass, <strong>ISRA</strong><br />
possesses a dominant market share. A broad product range, a global presence<br />
and technological leadership in many areas are further differentiators for the<br />
company. The company is thus faring significantly better in particular in the<br />
industries that show currently an under-proportionate market growth. This<br />
becomes obvious, when looking at the growth drivers in <strong>ISRA</strong>’s segments<br />
and management’s growth expectations for the current year. Both are<br />
summarised in the following table.<br />
Segment dynamics and expected growth rates for 2011<br />
Automotive<br />
(10-20%)<br />
Glass<br />
(>30%)<br />
Solar<br />
(20%)<br />
Plastics<br />
(>30%)<br />
Paper<br />
(>100%)<br />
Specialty Paper<br />
(~10%)<br />
Print<br />
(10-15%)<br />
Metal<br />
(~10%)<br />
• Demand for more complex products increasing<br />
• New sales personnel in China<br />
• New framework contract with German car manufacturer<br />
• Strong demand from China for different kinds of float glass<br />
• Demand from European manufacturers which export to China<br />
• New products (Floatscan 5D)<br />
• High demand for Si-solar cells and modules, in particular coming from China<br />
• High demand from Europe, China and North America resulting from sales initiatives and launch of new<br />
applications<br />
• New applications and broadened custormer base as a result fo Visconsys management joining <strong>ISRA</strong><br />
• New large custormer win<br />
• Bancruptcy of former competitor brings new customers<br />
• MAN Rosland is starting to market <strong>ISRA</strong>'s applications as add-on feature more acitively<br />
• Demand is slowly increasing, predominantly from Germany and Korea<br />
• New large manufacturer won in the Americas<br />
Source: <strong>MATELAN</strong> <strong>Research</strong> based on information provided by <strong>ISRA</strong><br />
On the base of the above analysis, we anticipate the following growth rates<br />
for the different areas in which <strong>ISRA</strong> is active. With more than 15.5%, we<br />
expect <strong>ISRA</strong> to grow higher than the anticipated growth for the German
<strong>ISRA</strong> <strong>VISION</strong> In-Depth Report<br />
… 8.6% in the medium<br />
term are conservative<br />
estimates<br />
- 28 -<br />
machine vision companies (11%), though the industry forecast is probably<br />
too low. In contrast, we remain below the more aggressive forecast for the<br />
European machine vision market (20%). Moreover, we remain below<br />
management’s expectations in most industries.<br />
We purposely do not extrapolate current growth rates into the future. In fact,<br />
we already account for the effects from a potential economic slowdown in<br />
2012. However, we still arrive at an average sales growth of 8.6% over the<br />
coming five years.<br />
Expected growth by area of activity<br />
30%<br />
25%<br />
20%<br />
15%<br />
10%<br />
5%<br />
0%<br />
Automotive<br />
Metal<br />
Source: <strong>MATELAN</strong> <strong>Research</strong><br />
Glass<br />
Plastics<br />
Paper<br />
2010/11e 2009/10 - 2014/15e<br />
Solar<br />
<strong>ISRA</strong> <strong>VISION</strong> In-Depth Report<br />
FINANCIAL ANALYSIS<br />
Conservative growth …<br />
… and margin<br />
assumptions<br />
- 29 -<br />
DRAWING A CONSERVATIVE GROWTH SCENARIO<br />
On the basis of the earlier described market analysis we have updated our<br />
financial forecasts for <strong>ISRA</strong>. The chart below illustrates how <strong>ISRA</strong>’s<br />
positioning in the different customer industries adds up to the group’s sales<br />
growth. We had already pointed out that we work on rather conservative<br />
assumptions for <strong>ISRA</strong>’s growth within its different industry segments. The<br />
chart below now illustrates that we price-in a material slowing of growth over<br />
the coming years. For 2012, we still anticipate a double-digit growth rate on<br />
the back of <strong>ISRA</strong>’s strong order backlog and the late cyclical nature of the<br />
industry. A potential economic slowdown should, however, show in<br />
subsequent years. We still expect <strong>ISRA</strong> to outgrow the global economy but<br />
staying conservative we only work with mid single-digit rates. Overall, we still<br />
arrive at a C<strong>AG</strong>R of 8.6% for the period 2009/10 to 2014/15e and remain<br />
below management’s target to reach more than EUR100m in sales in the<br />
medium term. It must be mentioned that these assumptions not only leave<br />
room for upward revisions, they are also based purely on organic growth. We<br />
had already pointed out that there is an opportunity to consolidate the market<br />
further.<br />
Development of net sales<br />
120<br />
100<br />
80<br />
60<br />
40<br />
20<br />
0<br />
09/10 10/11e 11/12e 12/13e 13/14e 14/15e<br />
Source: <strong>MATELAN</strong> <strong>Research</strong>, in EURm<br />
18%<br />
16%<br />
14%<br />
12%<br />
10%<br />
8%<br />
6%<br />
4%<br />
2%<br />
0%<br />
Metall Paper Print Plastics Solar Glass Automotive Overall growth (r.s.)<br />
The following picture gives additional evidence of the conservative nature of<br />
our model. Despite a continuous increase in sales and <strong>ISRA</strong>’s ongoing<br />
optimisation efforts, we assume just a slight margin increase over the period<br />
2010/2011e to 2014/2015e on gross profit as well as on EBIT level to 60%<br />
and 19.8%, respectively. As already pointed out in the valuation part of this<br />
report, we employ even lower rates for our terminal value calculation.
<strong>ISRA</strong> <strong>VISION</strong> In-Depth Report<br />
Net profit almost<br />
doubling until 2015<br />
- 30 -<br />
Development of sales and margins<br />
Source: <strong>MATELAN</strong> <strong>Research</strong>, in EURm<br />
The impact of our sales and margin assumptions on the development of EBT<br />
and net profit is depicted in the graph below. Driven by strong sales growth<br />
and a slight margin increase we expect an over-proportionate net profit<br />
growth of 28% in the current business year. With margins expected to show a<br />
slight rise until 2014/15e net profit C<strong>AG</strong>R 09/10-14/15e comes to 15.2%.<br />
This means net profit will double over the five-year period, although we<br />
remain 1pp below mgmt’s target to achieve a 20% EBT margin.<br />
Development of EBT and net profit<br />
25<br />
20<br />
15<br />
10<br />
5<br />
0<br />
120<br />
100<br />
80<br />
60<br />
40<br />
20<br />
0<br />
09/10<br />
10/11e<br />
Source: <strong>MATELAN</strong> <strong>Research</strong>, in EURm<br />
11/12e<br />
12/13e<br />
13/14e<br />
14/15e<br />
100%<br />
90%<br />
80%<br />
70%<br />
60%<br />
50%<br />
40%<br />
30%<br />
20%<br />
10%<br />
0%<br />
Net Sales (l.s.) Gross Margin EBITDA Margin EBIT Margin<br />
09/10<br />
10/11e<br />
11/12e<br />
12/13e<br />
13/14e<br />
14/15e<br />
EBT Net Profit Net Profit growth (r.s.)<br />
50%<br />
40%<br />
30%<br />
20%<br />
10%<br />
0%
<strong>ISRA</strong> <strong>VISION</strong> In-Depth Report<br />
Low capital intensity<br />
High net working capital<br />
needs<br />
Driving NWC further<br />
down could unlock<br />
additional value<br />
- 31 -<br />
WORKING CAPITAL IS THE MAIN BALANCE SHEET LEVER<br />
The anticipated balance sheet development is geared in essence to past ratios.<br />
Tangible assets only grow moderately as <strong>ISRA</strong>, being a software company,<br />
needs little equipment to pursue the business. The growth of intangible assets<br />
is linked to capitalized development, which usually accounts for 12% of net<br />
sales and grows accordingly (ex depreciation).<br />
Working capital has been a critical issue for <strong>ISRA</strong> for quite some time. The<br />
following table shows that at the end of the financial year 2009/10 <strong>ISRA</strong> had<br />
83% of the sales achieved in this year bound in working capital. This is<br />
materially higher than all of the competitors listed here. We find that while<br />
payable days outstanding even look very favourable and inventory turnover is<br />
still acceptable, it is in particular outstanding receivables that is spoiling the<br />
picture.<br />
Comparison of net working capital<br />
<strong>ISRA</strong> AVT Basler Viscom Cognex Perceptron Elexis Orbotech<br />
Sales 64.8 39.7 51.0 40.0 290.7 52.1 136.7 529.4<br />
Inventories 14.1 5.9 7.4 10.2 22.7 6.6 23.1 112.8<br />
Inventory turnover 79.5 54.5 53.2 92.7 28.5 45.9 61.7 77.8<br />
Trade Receivables 46.9 5.7 7.0 12.2 45.9 16.7 22.7 153.5<br />
Days outstanding 263.8 52.4 49.8 110.8 57.6 117.2 60.7 105.9<br />
Trade Payables 7.1 1.4 1.3 1.7 7.2 3.7 11.6 26.5<br />
Days outstanding 39.7 12.7 9.4 15.3 9.0 26.2 30.9 18.3<br />
Net Working Capital 53.9 10.2 13.1 20.6 61.5 19.5 34.3 239.8<br />
% of sales 83.2% 25.8% 25.7% 51.6% 21.1% 37.5% 25.1% 45.3%<br />
Source: Company reports of last financial year, in local currency (m)<br />
The following chart illustrates that debtor days have in fact reached a new<br />
high in the year 2009/10. Based on the improvements visible in 9M 10/11<br />
and management’s intensified efforts to improve cash management we<br />
already expect some improvement of all ratios in the current fiscal year.<br />
Going forward, we stick to our conservative approach by assuming stable<br />
debtor days and only marginal improvements in the other ratios. If the<br />
company continues to drive down net working capital, and the competitor<br />
analysis shows the leeway there is, this could unlock material value for the<br />
company.<br />
Development of key working capital ratios<br />
250<br />
200<br />
150<br />
100<br />
50<br />
0<br />
2004/05<br />
2005/06<br />
2006/07<br />
2007/08<br />
Source: <strong>MATELAN</strong> <strong>Research</strong>, in days<br />
2008/09<br />
2009/10<br />
2010/11e<br />
2011/12e<br />
2012/13e<br />
2013/14e<br />
Debtor days Stock turn Creditor days<br />
2014/15e
<strong>ISRA</strong> <strong>VISION</strong> In-Depth Report<br />
Earning cost of capital<br />
despite working capital<br />
needs and high goodwill<br />
Balance sheet still shows<br />
low gearing<br />
<strong>ISRA</strong> uses options to<br />
invest in the business<br />
Free cash flow assumed<br />
from current year<br />
onwards<br />
- 32 -<br />
High working capital needs as well as high goodwill are the main constituents<br />
of <strong>ISRA</strong>’s capital employed. This leads to a return on capital employed that<br />
was somewhat below the industry average in the past financial year. Stripping<br />
out intangibles already shows a much more favourable picture for <strong>ISRA</strong>.<br />
Further progress on the working capital side would turn <strong>ISRA</strong>’s above<br />
average sales margin into an industry leading return on capital employed. We<br />
had already pointed out in the valuation section of this report that even on<br />
the base of our conservative assumptions the company will earn its cost of<br />
capital in the current financial year by a margin and will continue to do so<br />
throughout our estimation period.<br />
Comparison of capital employed<br />
<strong>ISRA</strong> AVT Basler Viscom Cognex Perceptron Elexis Orbotech<br />
Intangibles 80.4 1.4 11.3 2.3 105.3 0.0 24.1 78.4<br />
PPE 2.8 1.4 21.3 1.2 29.6 5.9 18.1 24.8<br />
Net Working Capital 53.9 10.2 13.1 20.6 61.5 19.5 34.3 239.8<br />
Capital employed 137.1 13.1 45.6 24.2 196.4 25.5 76.5 343.1<br />
EBIT 11.5 0.4 6.7 7.1 75.7 -3.4 4.0 57.7<br />
RoCE 8.4% 2.7% 14.6% 29.5% 38.6% -13.5% 5.2% 16.8%<br />
RoCE (excl. Goodwill) 20.2% 3.0% 19.4% 32.6% 83.1% -13.5% 20.1% 21.8%<br />
Source: Company reports of last financial year, in local currency (m)<br />
Looking at equity and liabilities we find that more than half of <strong>ISRA</strong>’s balance<br />
sheet was covered by equity during the past financial year. This fits well into<br />
the industry context, though some companies show even ratios in excess of<br />
80%. As a result of the recent acquisitions, <strong>ISRA</strong>’s goodwill is almost as high<br />
as equity and the company is one of two companies listed here that do not<br />
possess a net cash position. Still, net debt comes to just 30% of equity.<br />
Comparison of equity and debt<br />
<strong>ISRA</strong> AVT Basler Viscom Cognex Perceptron Elexis Orbotech<br />
BS Total 160.9 30.7 58.9 62.2 533.1 64.7 132.4 628.3<br />
Equity 88.3 17.5 25.5 53.7 473.3 53.5 69.1 349.6<br />
Equity ratio 54.8% 57.1% 43.4% 86.3% 88.8% 82.7% 52.2% 55.6%<br />
Cash 8.0 10.8 9.1 26.1 33.2 9.8 31.7 184.8<br />
Financial Debt 34.5 0.0 28.7 2.5 0.0 0.0 20.7 128.0<br />
Net debt (-net cash) 26.5 -10.8 19.5 -23.6 -33.2 -9.8 -11.0 -56.8<br />
Gearing 0.3 -0.6 0.8 -0.4 -0.1 -0.2 -0.2 -0.2<br />
Source: Company reports of last financial year, in local currency (m)<br />
BACK TO POSITIVE FREE CASH FLOWS<br />
Despite the company’s high working capital needs, operating cash flow in the<br />
past financial year was significantly positive. Moreover, the following table<br />
illustrated that the industry left the companies sufficient room to produce<br />
free cash flow. <strong>ISRA</strong> was only negative on the free cash flow side due to the<br />
Graphikon acquisition, which shows that <strong>ISRA</strong> has still options to invest in<br />
the business, as is Cognex.<br />
Comparison of cash flows<br />
<strong>ISRA</strong> AVT Basler Viscom Cognex Perceptron Elexis Orbotech<br />
Operating Cash Flow 7.7 0.0 11.8 4.7 76.3 -1.5 14.4 49.1<br />
Investments -10.0 -0.3 -6.1 -4.4 -176.5 -9.9 -3.4 -7.0<br />
Free Cash Flow -2.2 -0.3 5.8 0.3 -100.1 -11.5 11.0 42.2<br />
Source: Company reports of last financial year, in local currency (m)<br />
As we are not pricing in any potential future acquisitions, we see free cash<br />
flows rising over the forecast period. As already mentioned, this is only the<br />
result of rather conservative growth and margin assumptions and not yet<br />
pricing in any further working capital improvements.
<strong>ISRA</strong> <strong>VISION</strong> In-Depth Report<br />
Double-digit sales and<br />
earnings growth<br />
continues in Q3<br />
Industrial automation<br />
driven by demand from<br />
automotive industry<br />
- 33 -<br />
Free cash flow development<br />
25<br />
20<br />
15<br />
10<br />
5<br />
0<br />
-5<br />
-10<br />
-15<br />
-20<br />
Source: <strong>MATELAN</strong> <strong>Research</strong>, in EURm<br />
Q3 SENDS POSITIVE SIGNALS FOR 2012<br />
The third quarter showed net sales increasing by 18%, which was better than<br />
we had anticipated (e: +15%). Gross margin decreased slightly from last<br />
year’s high level due to a different product mix, but gross profit nevertheless<br />
remained slightly above our forecast. The contiuned implementation of the<br />
cost optimization programme more than compensated the negative effect<br />
from the product mix and led to an over-proportionate y-o-y growth of EBT<br />
(+24%), which remained marginally ahead of our expectation. Due to a<br />
slightly higher than anticipated tax payment, net income (EUR2.2m/+24%)<br />
then came in fully in line with our forecast.<br />
Q3 review<br />
09/10<br />
10/11e<br />
11/12e<br />
Cash earnings Changes in NWC Investments Free Cash Flow (r.s.)<br />
Q3 10/11 Q3 09/10 % FY 10/11e<br />
% Mgmt outlook<br />
€ m estimated reported new old<br />
Net sales 18.5 19.0 16.1 18.2% 74.9 71.4 4.9% significantly above EUR70m<br />
Capitalized items 2.0 1.8 1.9 -3.0% 8.0 9.3 -13.8%<br />
Total Output 20.5 20.9 18.0 16.0% 82.9 80.7 2.7%<br />
Gross profit 12.3 12.4 10.8 14.9% 49.3 47.8 3.0%<br />
Gross margin 59.9% 59.6% 60.1% 59.4% 59.3%<br />
EBITDA 5.1 5.2 4.4 17.7% 20.8 21.1 -1.5%<br />
EBITDA margin 24.7% 24.8% 24.4% 25.1% 26.2%<br />
EBIT 3.3 3.4 2.8 22.6% 13.8 14.2 -2.7%<br />
EBIT margin 16.3% 16.5% 15.7% 16.7% 17.6%<br />
EBT 3.2 3.3 2.6 24.3% 13.0 13.2 -1.6%<br />
EBT margin 15.5% 15.6% 14.5% 15.7% 16.4% approx. 15.7%<br />
Net income 2.2 2.2 1.8 23.6% 9.0 9.1 -1.6%<br />
Net margin 10.7% 10.6% 9.9% 10.8% 11.3%<br />
EPS 0.51 0.51 0.42 22.2% 2.06 2.09 -1.6%<br />
Source: <strong>MATELAN</strong> <strong>Research</strong>, <strong>ISRA</strong> <strong>VISION</strong> (reported figures and outlook)<br />
Top line growth was driven by solid demand from all regions, with Europe<br />
(+45%) and Asia (+36%) remaining the main pillars. Sales from the Americas<br />
(+60%) benefitted strongly from <strong>ISRA</strong>’s increased sales and marketing<br />
efforts in this region. The segment reporting in the table below shows that<br />
both sales and earnings growth were higher in the industrial automation unit,<br />
which profited from an increasing demand from the automotive industry for<br />
<strong>ISRA</strong>’s 3D solutions, though from a low base. The surface vision unit also<br />
grew sales at a double-digit rate (+16%), but EBIT growth developed underproportionately<br />
(+6.5%). Mgmt stated that this was due to the mix of systems<br />
delivered in Q3 and that inter-annual margin flucuation even out over the<br />
quarters.<br />
12/13e<br />
13/14e<br />
14/15e<br />
10<br />
8<br />
6<br />
4<br />
2<br />
0<br />
-2<br />
-4<br />
-6<br />
-8
<strong>ISRA</strong> <strong>VISION</strong> In-Depth Report<br />
Full year forecasts still<br />
conservative ...<br />
Order backlog further<br />
increases to ‘significantly<br />
above EUR40m’<br />
Highest order entry<br />
from industries that<br />
appear to be more<br />
difficult<br />
- 34 -<br />
Segment reporting<br />
Industrial Automation Surface Vision<br />
Q3 10/11 Q3 09/10 % change Q3 10/11 Q3 09/10 % change<br />
Net sales 2.98 2.37 25.8% 16.04 13.72 16.9%<br />
EBIT 0.43 0.03 1600.0% 2.97 2.79 6.5%<br />
Source: <strong>ISRA</strong> <strong>VISION</strong>, in EURm<br />
The following chart illustrates that our full year estimates are still conservative<br />
although we have raised our forecasts. In fact, the company just needs to<br />
grow by 8% in the fourth quarter to reach our full year estimate, following a<br />
plus of 19% in the first nine month. On the margin side, the company<br />
showed some deterioration last year in the fourth quarter compared to the<br />
nine-month period. This year, we expect a stable development due to the<br />
better market situation and the finalization of the Graphikon acquisition.<br />
Sales and margins<br />
60<br />
50<br />
40<br />
30<br />
20<br />
10<br />
0<br />
9M Q4e<br />
Sales 09/10 Sales 10/11<br />
EBIT margin 09/10 EBIT margin 10/11<br />
Source: <strong>ISRA</strong> <strong>VISION</strong> (reported figures), <strong>MATELAN</strong> <strong>Research</strong> (estimates for Q4 10/11), margins shown as<br />
percentage of sales (not total output), in EURm<br />
This view is supported by a strong order backlog, which came in at<br />
‘significantly above EUR40m’ after ‘above EUR40m’ at the end of Q2. This<br />
suggests that order entry still exceeds billing. We would translate<br />
management’s statement into approximately EUR44m, i.e. showing a q-o-q<br />
increase of 10% in the backlog. Most importantly, the order book covers the<br />
sales expected for the fourth quarter almost twice, thus building already a<br />
strong base for the coming year. The following graph shows the development<br />
of sales and orders in the course of the year. In fact, we even expect the order<br />
book to increase slightly by the end of the financial year, which means that<br />
more than half of our sales estimate for the coming year would already be in<br />
the book.<br />
Segment-wise, mgmt stated that order entry in the third quarter was highest<br />
in the industrial automation unit (>50%, even excluding the framework<br />
agreement announced recently), though from a relative low base. In the<br />
surface vision business, demand from glass, plastics and paper industry was<br />
highest. Mgmt stated that the dynamic of the order entry at present remains<br />
high and that it cannot see any signs of a cooling down yet.<br />
30%<br />
25%<br />
20%<br />
15%<br />
10%<br />
5%<br />
0%
<strong>ISRA</strong> <strong>VISION</strong> In-Depth Report<br />
Order entry still<br />
accelerating<br />
FY outlook confirmed –<br />
double-digit growth<br />
expected for coming<br />
year<br />
- 35 -<br />
Order development and sales<br />
60<br />
50<br />
40<br />
30<br />
20<br />
10<br />
0<br />
Source: <strong>ISRA</strong> <strong>VISION</strong> (reported figures), <strong>MATELAN</strong> <strong>Research</strong><br />
Region-wise, most orders come from Europe (+51%) but the growth of<br />
order entry again is highest from the Americas (+60%). Thereby, both<br />
regions experience a further acceleration from the Q2 level. Most<br />
importantly, we are looking at growth rates in the order development that<br />
largely outstrip our sales forecasts, which further indicates that there might be<br />
some potential for upward revisions in our model.<br />
Order entry growth by region<br />
70%<br />
60%<br />
50%<br />
40%<br />
30%<br />
20%<br />
10%<br />
0%<br />
Source: <strong>ISRA</strong> <strong>VISION</strong><br />
Q1 HY 9M FY<br />
Sales 09/10 Sales 10/11 Order intake Order book<br />
Europe Americas Asia<br />
Against the background of the strong third quarter and the positive<br />
indications going forward, management has confirmed its full year targets of<br />
‘double digit revenue growth to significantly more than EUR70m’ and<br />
‘improving margins’. In view of the strong order development, management<br />
has even indicated that sales in the coming year should grow at a double-digit<br />
rate, irrespective of a potential economic slowdown. The late cyclical nature<br />
of the MV market and <strong>ISRA</strong>’s new products should in our view help in this<br />
respect.
<strong>ISRA</strong> <strong>VISION</strong> In-Depth Report<br />
Mid-term growth targets<br />
reiterated<br />
Higher estimates but not<br />
less conservative<br />
Acquisitions still in the<br />
pipeline<br />
Free cash flow expected<br />
to turn positive by yearend<br />
- 36 -<br />
For the mid-term, mgmt reiterated its target of achieving a net sales level of<br />
‘+EUR100m in the next years’. The main elements of its growth strategy<br />
remain (1) the expansion of its market share in its current markets, (2) the<br />
sale of its products into new regions and sales channels as well as (3) the<br />
innovation of new products for existing customers.<br />
The next table illustrates that following good Q3 figures we have become<br />
more optimistic with regard to <strong>ISRA</strong>’s financials in the coming years, without<br />
leaving the conservative nature of our model behind and accounting for a<br />
potential economic slowdown.<br />
Changes in our model<br />
FY 10/11e Change FY 11/12e Change FY 12/13e Change<br />
€ m new old % new old % new old %<br />
Net sales 74.9 71.4 4.9% 82.4 75.5 9.1% 87.3 80.1 8.9%<br />
Capitalized items 8.0 9.3 -13.8% 9.1 9.3 -1.6% 8.7 9.9 -11.3%<br />
Total Output 82.9 80.7 2.7% 91.5 84.8 8.0% 96.1 90.0 6.7%<br />
Gross profit 49.3 47.8 3.0% 54.2 50.0 8.3% 56.9 53.3 6.7%<br />
Gross margin 59.4% 59.3% 59.2% 59.0% 59.2% 59.2%<br />
EBITDA 20.8 21.1 -1.5% 23.7 22.6 5.0% 25.4 24.1 5.1%<br />
EBITDA margin 25.1% 26.2% 25.9% 26.6% 26.4% 26.8%<br />
EBIT 13.8 14.2 -2.7% 16.4 15.3 7.2% 17.8 16.4 8.5%<br />
EBIT margin 16.7% 17.6% 17.9% 18.0% 18.5% 18.2%<br />
EBT 13.0 13.2 -1.6% 15.5 14.3 8.2% 16.9 15.5 9.3%<br />
EBT margin 15.7% 16.4% 17.0% 16.9% 17.6% 17.2%<br />
Net income 9.0 9.1 -1.6% 10.7 9.9 8.2% 11.7 10.7 9.3%<br />
Net margin 10.8% 11.3% 11.7% 11.7% 12.2% 11.9%<br />
EPS 2.06 2.09 -1.6% 2.46 2.27 8.2% 2.68 2.45 9.3%<br />
Source: <strong>MATELAN</strong> <strong>Research</strong>, in EURm<br />
In addition to this organic growth strategy, mgmt continues to work on a<br />
couple of acquisition projects in order to gain access to further markets<br />
and/or to add further technologies to its product portfolio. Management<br />
made it clear that it expects one more acquisition to take place in the current<br />
calender year.<br />
Cash flow for the nine-month period was not as strong as in the first half. As<br />
the graph below shows, gross operating cash flow (ex. changes in NWC)<br />
increased by 12% from EUR12.4m in 9M 09/10 to EUR14.0m in 9m 10/11)<br />
mainly driven by the increase in earnings. However, cash requirements for net<br />
working capital increased over-proportionately (from EUR-8.4m to EUR-<br />
9.9m/18%) due to the strong business expansion. Operating cash flow was<br />
thus almost stable at EUR4m. Capex was just marginally below last year’s<br />
level. Consequently, free cash flow showed a slight improvement from EUR-<br />
3.0m to EUR-2.3m but remained negative. For the full year, free cash flow<br />
should be positive.<br />
Cash flow development<br />
20.000<br />
15.000<br />
10.000<br />
5.000<br />
0.000<br />
-5.000<br />
-10.000<br />
-15.000<br />
-20.000<br />
Source: <strong>ISRA</strong> <strong>VISION</strong>, in EURm<br />
9M 09/10 9M 10/11<br />
CAPEX Change in NWC Gross operating cash flow FCF
<strong>ISRA</strong> <strong>VISION</strong> In-Depth Report<br />
Sales and EBIT-margin Adj. EPS and DPS<br />
120<br />
100<br />
80<br />
60<br />
40<br />
20<br />
Source: <strong>MATELAN</strong> <strong>Research</strong>, EURm Source: <strong>MATELAN</strong> <strong>Research</strong>, EUR<br />
Operating cash flow and free cash flow Capital expenditure and depreciation<br />
Source: <strong>MATELAN</strong> <strong>Research</strong>, EURm Source: <strong>MATELAN</strong> <strong>Research</strong>, EURm<br />
Equity and net debt RoCE and RoE<br />
Source: <strong>MATELAN</strong> <strong>Research</strong>, EURm Source: <strong>MATELAN</strong> <strong>Research</strong><br />
- 37 -<br />
0<br />
25<br />
20<br />
15<br />
10<br />
5<br />
0<br />
-5<br />
-10<br />
-15<br />
-20<br />
160.0<br />
140.0<br />
120.0<br />
100.0<br />
80.0<br />
60.0<br />
40.0<br />
20.0<br />
0.0<br />
2008<br />
2008<br />
2009<br />
2010<br />
2011e<br />
2012e<br />
2013e<br />
2014e<br />
2015e<br />
Sales (l.s.) EBIT-margin (r.s.)<br />
2009<br />
2010<br />
2011e<br />
2012e<br />
2013e<br />
2014e<br />
Opearting cash flow Free cash flow<br />
2008<br />
2009<br />
2010<br />
2011e<br />
2012e<br />
2013e<br />
Equity Net debt<br />
2014e<br />
2015e<br />
25%<br />
20%<br />
15%<br />
10%<br />
5%<br />
0%<br />
2015e<br />
3.5<br />
3.0<br />
2.5<br />
2.0<br />
1.5<br />
1.0<br />
0.5<br />
0.0<br />
12<br />
10<br />
8<br />
6<br />
4<br />
2<br />
0<br />
12%<br />
10%<br />
8%<br />
6%<br />
4%<br />
2%<br />
0%<br />
2008<br />
2008<br />
2008<br />
2009<br />
2009<br />
2010<br />
2011e<br />
2012e<br />
2013e<br />
Adj. EPS DPS<br />
2010<br />
2011e<br />
2012e<br />
2013e<br />
2014e<br />
Capex Depreciation<br />
2009<br />
2010<br />
2011e<br />
2012e<br />
2013e<br />
2014e<br />
2014e<br />
RoCE RoE<br />
2015e<br />
2015e<br />
2015e
<strong>ISRA</strong> <strong>VISION</strong> In-Depth Report<br />
PROFIT & LOSS ACCOUNT<br />
EURm 2008 2009 2010 2011e 2012e 2013e 2014e 2015e<br />
Sales 68.3 58.2 64.8 74.9 82.4 87.3 92.6 98.1<br />
Growth 33.1% n.m. 11.5% 15.5% 10.0% 6.0% 6.0% 6.0%<br />
Change invent. / intern. prod. assets 8.0 7.7 7.9 8.0 9.1 8.7 9.4 10.1<br />
Total Output 76.3 65.9 72.8 82.9 91.5 96.1 101.9 108.2<br />
Growth 30.3% n.m. 10.5% 13.9% 10.4% 5.0% 6.1% 6.1%<br />
Cost of goods sold -32.0 -27.8 -30.2 -33.6 -37.3 -39.2 -41.1 -43.3<br />
Gross profit 44.3 38.1 42.6 49.3 54.2 56.9 60.9 64.9<br />
Gross-margin 58.0% 57.8% 58.6% 59.4% 59.2% 59.2% 59.7% 60.0%<br />
Sales expenses -10.8 -10.0 -11.3 -12.7 -13.5 -14.2 -15.1 -16.0<br />
<strong>Research</strong> and development expenses -10.8 -10.2 -11.0 -12.5 -13.3 -13.6 -14.4 -15.1<br />
General and administrative expenses -4.3 -3.7 -3.8 -3.7 -4.1 -4.1 -4.3 -4.3<br />
Other operating result 0.3 1.0 1.1 0.5 0.5 0.5 0.5 0.5<br />
EBITDA 18.6 15.2 17.7 20.8 23.7 25.4 27.6 30.0<br />
EBITDA-margin 24.4% 23.0% 24.3% 25.1% 25.9% 26.4% 27.1% 27.7%<br />
Amortisation and Depreciation -5.7 -5.9 -6.2 -7.0 -7.3 -7.6 -8.1 -8.5<br />
EBIT 12.9 9.3 11.5 13.8 16.4 17.8 19.6 21.4<br />
EBIT-margin 16.9% 14.1% 15.8% 16.7% 17.9% 18.5% 19.2% 19.8%<br />
Interest result -1.6 -1.0 -0.9 -0.9 -0.9 -0.8 -0.8 -0.8<br />
Participation result 0.0 0.0 0.0 0.0 0.0 0.0 0.0 0.0<br />
Other financial result 0.0 0.0 0.0 0.0 0.0 0.0 0.0 0.0<br />
Financial result -1.6 -1.0 -0.9 -0.8 -0.9 -0.8 -0.8 -0.8<br />
Extraordinary result 0.0 0.0 0.0 0.0 0.0 0.0 0.0 0.0<br />
EBT 11.3 8.3 10.6 13.0 15.5 16.9 18.7 20.6<br />
Income taxes -3.3 -1.8 -3.6 -4.0 -4.8 -5.2 -5.8 -6.4<br />
Discontinued operations 0.0 0.0 0.0 0.0 0.0 0.0 0.0 0.0<br />
Net profit 8.0 6.4 7.0 9.0 10.7 11.7 12.9 14.2<br />
Growth 44.2% -19.7% 9.1% 28.1% 19.3% 9.1% 10.8% 9.9%<br />
Minorities -0.4 0.0 -0.1 0.0 0.0 -0.1 -0.1 -0.1<br />
Net profit after minorities 7.6 6.5 6.9 8.9 10.7 11.6 12.9 14.2<br />
Average no. of shares (m) 4.3 4.3 4.3 4.3 4.3 4.3 4.3 4.3<br />
EPS (EUR) 1.76 1.52 1.62 2.06 2.46 2.68 2.97 3.27<br />
Growth 48.8% -13.5% 6.4% 27.5% 19.3% 9.1% 10.8% 9.9%<br />
Adj. EPS (EUR) 1.76 1.52 1.62 2.06 2.46 2.68 2.97 3.27<br />
Growth 48.8% n.m. 6.4% 27.5% 19.3% 9.1% 10.8% 9.9%<br />
DPS (EUR) 0.15 0.15 0.20 0.21 0.22 0.23 0.24 0.26<br />
Payout Ratio 8.5% 9.9% 12.4% 10.2% 9.0% 8.6% 8.2% 7.8%<br />
BALANCE SHEET<br />
0001<br />
EURm 2008 2009 2010 2011e 2012e 2013e 2014e 2015e<br />
Intangible assets 69.7 71.5 80.4 83.5 85.3 86.5 87.8 89.3<br />
thereof goodwill 38.7 37.6 37.3 39.4 39.4 39.4 39.4 39.4<br />
Tangible assets 2.6 2.7 2.8 3.4 4.1 4.8 5.5 6.3<br />
Financial assets 0.0 0.0 0.0 0.0 0.0 0.0 0.0 0.0<br />
Other fixed assets 3.3 4.5 5.3 5.3 5.3 5.3 5.3 5.3<br />
Fixed assets 75.6 78.6 88.5 92.2 94.7 96.5 98.6 100.9<br />
Inventories 17.2 15.1 14.1 15.7 17.3 18.2 19.3 20.4<br />
Accounts receivable 37.8 37.1 46.9 50.2 55.4 58.2 61.7 65.5<br />
Cash and marketable securities 12.5 7.2 8.0 5.0 3.9 4.8 5.3 7.2<br />
Other current assets 6.5 3.8 3.4 3.4 3.4 3.4 3.4 3.4<br />
Current assets 74.1 63.2 72.5 74.3 80.0 84.6 89.7 96.6<br />
TOTAL ASSETS 149.7 141.8 160.9 166.5 174.7 181.1 188.3 197.5<br />
Subscribed capital 4.3 4.4 4.4 4.4 4.4 4.4 4.4 4.4<br />
Reserves 37.2 37.8 38.1 38.1 38.1 38.1 38.1 38.1<br />
Other equity capital 33.0 38.2 45.0 53.3 63.4 74.4 86.7 100.3<br />
Minorities 1.2 0.8 0.8 0.8 0.8 0.8 0.8 0.8<br />
Shareholder's equity 75.7 81.2 88.3 96.6 106.6 117.7 129.9 143.5<br />
Equity ratio 50.6% 57.3% 54.8% 58.0% 61.0% 65.0% 69.0% 72.7%<br />
Short term financial liabilities 13.5 2.2 10.7 9.2 7.8 6.7 5.8 4.9<br />
Long term financial liabilities 24.9 26.9 23.8 22.3 20.6 15.6 10.7 5.7<br />
Financial liabilities 38.4 29.2 34.5 31.4 28.5 22.4 16.4 10.6<br />
Gearing 50.7% 35.9% 39.1% 32.5% 26.7% 19.0% 12.6% 7.4%<br />
Pension and similar provisions 1.8 1.8 1.9 2.2 2.4 2.5 2.7 2.8<br />
Other provisions 1.2 0.8 0.8 0.8 0.8 0.8 0.8 0.8<br />
Provisions 3.0 2.6 2.6 2.9 3.2 3.3 3.4 3.6<br />
Accounts payable 8.3 5.3 7.1 8.9 9.8 10.3 10.9 11.6<br />
Advances received 0.0 0.0 0.0 0.0 0.0 0.0 0.0 0.0<br />
Trade liabilities 8.3 5.3 7.1 8.9 9.8 10.3 10.9 11.6<br />
Other liabilities 24.4 23.5 28.5 26.7 26.7 27.6 27.6 28.2<br />
TOTAL LIABILITIES 149.7 141.8 160.9 166.5 174.7 181.1 188.3 197.5<br />
- 38 -
<strong>ISRA</strong> <strong>VISION</strong> In-Depth Report<br />
CASH FLOW<br />
0001<br />
EURm 2008 2009 2010 2011e 2012e 2013e 2014e 2015e<br />
EBIT 12.9 9.3 11.5 13.8 16.4 17.8 19.6 21.4<br />
Depreciation and amortization 5.7 5.9 6.2 7.0 7.3 7.6 8.1 8.5<br />
Change in other provisons 0.1 0.2 -0.2 0.3 0.2 0.1 0.2 0.2<br />
Change in working capital -8.1 -0.3 -10.6 -3.1 -5.9 -3.1 -4.0 -4.3<br />
Change in other assets & liabilities -2.5 -0.1 0.0 -1.7 -0.1 0.9 0.0 0.6<br />
Financial result -1.5 -1.0 -0.9 -0.9 -0.9 -0.8 -0.8 -0.8<br />
Extraordinary result 0.0 0.0 0.0 0.0 0.0 0.0 0.0 0.0<br />
Discontinued operations 0.0 0.0 0.0 0.0 0.0 0.0 0.0 0.0<br />
Taxes -1.7 1.4 0.9 -4.0 -4.8 -5.2 -5.8 -6.4<br />
Cash flow from operating activities 4.91 15.36 6.86 11.43 12.27 17.14 17.14 19.20<br />
Net investments in intangible assets -8.5 -8.3 -7.9 -8.0 -9.1 -8.7 -9.4 -10.1<br />
Net investments in tangiblel assets -0.5 -0.7 -0.5 -0.6 -0.7 -0.7 -0.7 -0.8<br />
Net investments in financial assets 0.0 0.0 -0.2 0.0 0.0 0.0 0.0 0.0<br />
Net investments in other fix assets -13.5 -1.9 -1.6 -2.1 0.0 0.0 0.0 0.0<br />
Cash flow from investing activities -22.5 -10.8 -10.2 -10.7 -9.8 -9.4 -10.1 -10.8<br />
Change in financial liabilities 9.0 -9.2 4.7 -3.1 -3.0 -6.1 -5.9 -5.8<br />
Change in shareholder's equity -0.5 0.0 -0.1 0.0 0.0 0.0 0.0 0.0<br />
Change in pensions and similar prov. 0.0 0.0 0.0 0.0 0.0 0.0 0.0 0.0<br />
Dividend payments -0.7 -0.6 -0.7 -0.7 -0.7 -0.7 -0.7 -0.7<br />
Other / Consolidation / Currency 0.0 -0.1 0.2 0.0 0.0 0.0 0.0 0.0<br />
Cash flow from financing activities 7.9 -9.9 4.2 -3.7 -3.6 -6.7 -6.6 -6.5<br />
Cash at the beginning of period 22.3 12.5 7.2 8.0 5.0 3.9 4.8 5.3<br />
Change in cash -9.7 -5.4 0.9 -3.0 -1.1 1.0 0.4 1.9<br />
Cash at the end of period 12.5 7.2 8.0 5.0 3.9 4.8 5.3 7.2<br />
GROWTH<br />
2008 2009 2010 2011e 2012e 2013e 2014e 2015e<br />
Sales 33.1% -14.8% 11.5% 15.5% 10.0% 6.0% 6.0% 6.0%<br />
EBITDA 70.1% -18.4% 16.3% 17.9% 13.8% 7.0% 8.9% 8.5%<br />
EBIT 110.3% -28.4% 24.0% 20.3% 18.5% 8.5% 10.1% 9.4%<br />
Net profit 48.0% -14.7% 7.5% 28.0% 19.8% 9.1% 10.8% 9.9%<br />
MARGINS<br />
2008 2009 2010 2011e 2012e 2013e 2014e 2015e<br />
Gross 58.0% 57.8% 58.6% 59.4% 59.2% 59.2% 59.7% 60.0%<br />
EBITDA 24.4% 23.0% 24.3% 25.1% 25.9% 26.4% 27.1% 27.7%<br />
EBIT 16.9% 14.1% 15.8% 16.7% 17.9% 18.5% 19.2% 19.8%<br />
Net 10.5% 9.7% 9.6% 10.8% 11.7% 12.2% 12.7% 13.1%<br />
PROFITABILITY<br />
2008 2009 2010 2011e 2012e 2013e 2014e 2015e<br />
RoE 10.6% 7.9% 7.9% 9.3% 10.0% 9.9% 9.9% 9.9%<br />
RoA 7.5% 7.5% 7.7% 5.9% 6.6% 6.9% 7.3% 7.6%<br />
RoCE 10.7% 10.1% 10.5% 7.8% 8.6% 9.0% 9.5% 10.0%<br />
CAPITAL STRUCTURE<br />
2008 2009 2010 2011e 2012e 2013e 2014e 2015e<br />
Equity ratio 50.6% 57.3% 54.8% 58.0% 61.0% 65.0% 69.0% 72.7%<br />
Gearing 34.1% 27.1% 30.0% 27.3% 23.0% 14.9% 8.6% 2.4%<br />
Average interest 6.2% 4.5% 3.3% 3.4% 3.5% 4.9% 7.5% 23.8%<br />
Asset turnover 0.5 0.5 0.5 0.5 0.5 0.5 0.5 0.5<br />
Net working capital / sales 98.6% 118.5% 133.7% 122.2% 122.7% 121.5% 121.6% 121.7%<br />
Receivables days outstanding 202 233 264 245 245 243 243 244<br />
Payables days outstanding 44 33 40 43 43 43 43 43<br />
VALUATION<br />
2008 2009 2010 2011e 2012e 2013e 2014e 2015e<br />
Share price 6.0 11.6 17.1 17.4 17.4 17.4 17.4 17.4<br />
x No of shares 4.3 4.3 4.4 4.3 4.3 4.3 4.3 4.3<br />
= Market Cap 25.9 49.4 74.9 75.4 75.4 75.4 75.4 75.4<br />
+ Net debt 25.8 22.0 26.5 26.4 24.6 17.5 11.1 3.4<br />
+ LT provisions 1.8 1.8 1.9 2.2 2.4 2.5 2.7 2.8<br />
+ Minorities 1.2 0.8 0.8 0.8 0.8 0.8 0.8 0.8<br />
- Participations 0.0 0.0 0.0 0.0 0.0 0.0 0.0 1.0<br />
=Enterprise Value 54.7 73.9 104.0 104.7 103.1 96.2 90.0 81.4<br />
EV / Sales 0.8 1.3 1.6 1.4 1.3 1.1 1.0 0.8<br />
EV / EBITDA 2.9 4.9 5.9 5.0 4.4 3.8 3.3 2.7<br />
EV / EBIT 4.2 8.0 9.1 7.6 6.3 5.4 4.6 3.8<br />
PE 3.4 7.6 10.6 8.5 7.1 6.5 5.9 5.3<br />
Dividend yield 2.5% 1.3% 1.2% 1.2% 1.3% 1.3% 1.4% 1.5%<br />
- 39 -
<strong>ISRA</strong> <strong>VISION</strong> In-Depth Report<br />
ADDITIONAL DISCLOSURES<br />
This report has been prepared by Matelan <strong>Research</strong> GmbH, Koblenzer Str. 79, 53177 Bonn.<br />
(1) Analyst certification<br />
The analyst(s) responsible for the content of this research report hereby certifies that (1) all views expressed in this<br />
report accurately reflect his/her views about any and all of the subject securities or issuers and (2) no part of his/her<br />
compensation was, is or will be directly or indirectly related to the specific recommendation(s) or view(s) of this<br />
report.<br />
Matelan may have sent extracts of this research report to the subject company for the purpose of verifying factual<br />
accuracy. The information provided by the latter was taken into consideration in the report. However, this entailed<br />
no change of the assessment.<br />
(2) Important Disclosures<br />
<strong>MATELAN</strong> <strong>Research</strong> GmbH has/will receive(d) compensation from the company discussed for research and<br />
advisory services provided in the current calendar year.<br />
(3) Rating definitions<br />
Stock ratings are defined as follows:<br />
Strong Buy: In the next 6 to 12 months, we expect a potential absolute change in value of over 20% with<br />
high forecast certainty.<br />
Buy: In the next 6 to 12 months, we expect a potential absolute change in value of more than 10%.<br />
Neutral: In the next 6 to 12 months, we expect a potential absolute change in value of over 0% up to a<br />
maximum of 10%.<br />
Reduce: In the next 6 to 12 months, we expect a potential absolute negative change in value of up<br />
to -10%.<br />
Sell: In the next 6 to 12 months, we expect a potential absolute negative change in value of over<br />
-10 % with high forecast certainty.<br />
DISCLAIMER<br />
This research publication has been prepared by Matelan analysts. It is published solely for informational purposes of<br />
its professional and institutional clients. While reasonable care has been taken to ensure that the information<br />
contained herein is not untrue or misleading at the time of publication, Matelan provides no representation or<br />
warranty in relation to its accuracy, completeness or reliability. Any opinions contained herein are subject to change<br />
without notice. The analysis contained herein is based on numerous assumptions. Different assumptions could result<br />
in materially different results. Matelan does not accept any liability for any loss or damage out of the use of all or any<br />
part of this report. Additional information will be made available upon request. Any investments referred to herein<br />
may involve significant risk, are not necessarily available in all jurisdictions, may be illiquid and not be suitable for all<br />
investors. The value of, or income from, any investments referred to herein may fluctuate and/or be affected by<br />
changes in exchange rates. Past performance is not necessarily indicative of future results. Investors should make<br />
their own investment decisions without relying on this publication. Only investors with sufficient knowledge and<br />
experience in financial matters to evaluate the merits and risks should consider an investment in any issuers or<br />
market discussed herein and other persons should not take any action on the basis of this publication.<br />
- 40 -
<strong>ISRA</strong> <strong>VISION</strong> In-Depth Report<br />
ADDITIONAL INFORMATION<br />
All rights are reserved. Copyrights and database rights protection exists in this publication. It may not be reproduced<br />
or redistributed without prior express permission of Matelan.<br />
Matelan <strong>Research</strong> and Oppenheim <strong>Research</strong> have an agreement that allows Sal. Oppenheim to distribute research<br />
published by Matelan <strong>Research</strong> to its professional and institutional clients. Matelan is independent of Sal.<br />
Oppenheim and the agreement between the two companies is structured to guarantee the independence of Matelan’s<br />
research. Nevertheless, for additional information on Sal. Oppenheim’s disclosures and policies for managing<br />
conflicts of interests please refer to http://www.sal-oppenheim.com/com/04_research/06_compliance/04_06.htm.<br />
This document may not be distributed in the UK, in the United States, Canada, Australia or Japan or to any U.S.<br />
person.<br />
CONTACT DATA<br />
For further information please contact:<br />
Matelan <strong>Research</strong> GmbH<br />
Koblenzer Straße 79<br />
53177 Bonn<br />
www.matelan.de<br />
- 41 -<br />
Analyst:<br />
Anne Gronski<br />
Tel: +49 228 2401 7478<br />
e-mail: anne.gronski@matelan.de