MATELAN Research - ISRA VISION AG
MATELAN Research - ISRA VISION AG
MATELAN Research - ISRA VISION AG

Create successful ePaper yourself
Turn your PDF publications into a flip-book with our unique Google optimized e-Paper software.
<strong>ISRA</strong> <strong>VISION</strong> In-Depth Report<br />
Earning cost of capital<br />
despite working capital<br />
needs and high goodwill<br />
Balance sheet still shows<br />
low gearing<br />
<strong>ISRA</strong> uses options to<br />
invest in the business<br />
Free cash flow assumed<br />
from current year<br />
onwards<br />
- 32 -<br />
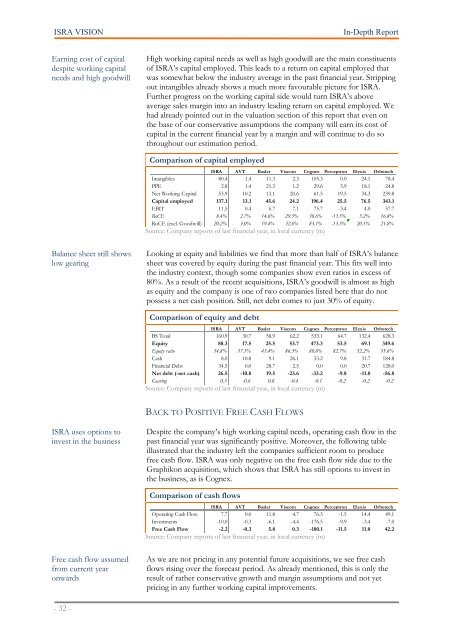
High working capital needs as well as high goodwill are the main constituents<br />
of <strong>ISRA</strong>’s capital employed. This leads to a return on capital employed that<br />
was somewhat below the industry average in the past financial year. Stripping<br />
out intangibles already shows a much more favourable picture for <strong>ISRA</strong>.<br />
Further progress on the working capital side would turn <strong>ISRA</strong>’s above<br />
average sales margin into an industry leading return on capital employed. We<br />
had already pointed out in the valuation section of this report that even on<br />
the base of our conservative assumptions the company will earn its cost of<br />
capital in the current financial year by a margin and will continue to do so<br />
throughout our estimation period.<br />
Comparison of capital employed<br />
<strong>ISRA</strong> AVT Basler Viscom Cognex Perceptron Elexis Orbotech<br />
Intangibles 80.4 1.4 11.3 2.3 105.3 0.0 24.1 78.4<br />
PPE 2.8 1.4 21.3 1.2 29.6 5.9 18.1 24.8<br />
Net Working Capital 53.9 10.2 13.1 20.6 61.5 19.5 34.3 239.8<br />
Capital employed 137.1 13.1 45.6 24.2 196.4 25.5 76.5 343.1<br />
EBIT 11.5 0.4 6.7 7.1 75.7 -3.4 4.0 57.7<br />
RoCE 8.4% 2.7% 14.6% 29.5% 38.6% -13.5% 5.2% 16.8%<br />
RoCE (excl. Goodwill) 20.2% 3.0% 19.4% 32.6% 83.1% -13.5% 20.1% 21.8%<br />
Source: Company reports of last financial year, in local currency (m)<br />
Looking at equity and liabilities we find that more than half of <strong>ISRA</strong>’s balance<br />
sheet was covered by equity during the past financial year. This fits well into<br />
the industry context, though some companies show even ratios in excess of<br />
80%. As a result of the recent acquisitions, <strong>ISRA</strong>’s goodwill is almost as high<br />
as equity and the company is one of two companies listed here that do not<br />
possess a net cash position. Still, net debt comes to just 30% of equity.<br />
Comparison of equity and debt<br />
<strong>ISRA</strong> AVT Basler Viscom Cognex Perceptron Elexis Orbotech<br />
BS Total 160.9 30.7 58.9 62.2 533.1 64.7 132.4 628.3<br />
Equity 88.3 17.5 25.5 53.7 473.3 53.5 69.1 349.6<br />
Equity ratio 54.8% 57.1% 43.4% 86.3% 88.8% 82.7% 52.2% 55.6%<br />
Cash 8.0 10.8 9.1 26.1 33.2 9.8 31.7 184.8<br />
Financial Debt 34.5 0.0 28.7 2.5 0.0 0.0 20.7 128.0<br />
Net debt (-net cash) 26.5 -10.8 19.5 -23.6 -33.2 -9.8 -11.0 -56.8<br />
Gearing 0.3 -0.6 0.8 -0.4 -0.1 -0.2 -0.2 -0.2<br />
Source: Company reports of last financial year, in local currency (m)<br />
BACK TO POSITIVE FREE CASH FLOWS<br />
Despite the company’s high working capital needs, operating cash flow in the<br />
past financial year was significantly positive. Moreover, the following table<br />
illustrated that the industry left the companies sufficient room to produce<br />
free cash flow. <strong>ISRA</strong> was only negative on the free cash flow side due to the<br />
Graphikon acquisition, which shows that <strong>ISRA</strong> has still options to invest in<br />
the business, as is Cognex.<br />
Comparison of cash flows<br />
<strong>ISRA</strong> AVT Basler Viscom Cognex Perceptron Elexis Orbotech<br />
Operating Cash Flow 7.7 0.0 11.8 4.7 76.3 -1.5 14.4 49.1<br />
Investments -10.0 -0.3 -6.1 -4.4 -176.5 -9.9 -3.4 -7.0<br />
Free Cash Flow -2.2 -0.3 5.8 0.3 -100.1 -11.5 11.0 42.2<br />
Source: Company reports of last financial year, in local currency (m)<br />
As we are not pricing in any potential future acquisitions, we see free cash<br />
flows rising over the forecast period. As already mentioned, this is only the<br />
result of rather conservative growth and margin assumptions and not yet<br />
pricing in any further working capital improvements.