MATELAN Research - ISRA VISION AG
MATELAN Research - ISRA VISION AG
MATELAN Research - ISRA VISION AG

Create successful ePaper yourself
Turn your PDF publications into a flip-book with our unique Google optimized e-Paper software.
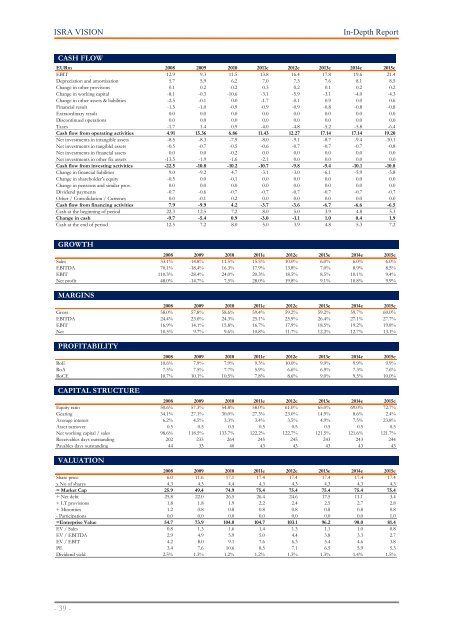
<strong>ISRA</strong> <strong>VISION</strong> In-Depth Report<br />
CASH FLOW<br />
0001<br />
EURm 2008 2009 2010 2011e 2012e 2013e 2014e 2015e<br />
EBIT 12.9 9.3 11.5 13.8 16.4 17.8 19.6 21.4<br />
Depreciation and amortization 5.7 5.9 6.2 7.0 7.3 7.6 8.1 8.5<br />
Change in other provisons 0.1 0.2 -0.2 0.3 0.2 0.1 0.2 0.2<br />
Change in working capital -8.1 -0.3 -10.6 -3.1 -5.9 -3.1 -4.0 -4.3<br />
Change in other assets & liabilities -2.5 -0.1 0.0 -1.7 -0.1 0.9 0.0 0.6<br />
Financial result -1.5 -1.0 -0.9 -0.9 -0.9 -0.8 -0.8 -0.8<br />
Extraordinary result 0.0 0.0 0.0 0.0 0.0 0.0 0.0 0.0<br />
Discontinued operations 0.0 0.0 0.0 0.0 0.0 0.0 0.0 0.0<br />
Taxes -1.7 1.4 0.9 -4.0 -4.8 -5.2 -5.8 -6.4<br />
Cash flow from operating activities 4.91 15.36 6.86 11.43 12.27 17.14 17.14 19.20<br />
Net investments in intangible assets -8.5 -8.3 -7.9 -8.0 -9.1 -8.7 -9.4 -10.1<br />
Net investments in tangiblel assets -0.5 -0.7 -0.5 -0.6 -0.7 -0.7 -0.7 -0.8<br />
Net investments in financial assets 0.0 0.0 -0.2 0.0 0.0 0.0 0.0 0.0<br />
Net investments in other fix assets -13.5 -1.9 -1.6 -2.1 0.0 0.0 0.0 0.0<br />
Cash flow from investing activities -22.5 -10.8 -10.2 -10.7 -9.8 -9.4 -10.1 -10.8<br />
Change in financial liabilities 9.0 -9.2 4.7 -3.1 -3.0 -6.1 -5.9 -5.8<br />
Change in shareholder's equity -0.5 0.0 -0.1 0.0 0.0 0.0 0.0 0.0<br />
Change in pensions and similar prov. 0.0 0.0 0.0 0.0 0.0 0.0 0.0 0.0<br />
Dividend payments -0.7 -0.6 -0.7 -0.7 -0.7 -0.7 -0.7 -0.7<br />
Other / Consolidation / Currency 0.0 -0.1 0.2 0.0 0.0 0.0 0.0 0.0<br />
Cash flow from financing activities 7.9 -9.9 4.2 -3.7 -3.6 -6.7 -6.6 -6.5<br />
Cash at the beginning of period 22.3 12.5 7.2 8.0 5.0 3.9 4.8 5.3<br />
Change in cash -9.7 -5.4 0.9 -3.0 -1.1 1.0 0.4 1.9<br />
Cash at the end of period 12.5 7.2 8.0 5.0 3.9 4.8 5.3 7.2<br />
GROWTH<br />
2008 2009 2010 2011e 2012e 2013e 2014e 2015e<br />
Sales 33.1% -14.8% 11.5% 15.5% 10.0% 6.0% 6.0% 6.0%<br />
EBITDA 70.1% -18.4% 16.3% 17.9% 13.8% 7.0% 8.9% 8.5%<br />
EBIT 110.3% -28.4% 24.0% 20.3% 18.5% 8.5% 10.1% 9.4%<br />
Net profit 48.0% -14.7% 7.5% 28.0% 19.8% 9.1% 10.8% 9.9%<br />
MARGINS<br />
2008 2009 2010 2011e 2012e 2013e 2014e 2015e<br />
Gross 58.0% 57.8% 58.6% 59.4% 59.2% 59.2% 59.7% 60.0%<br />
EBITDA 24.4% 23.0% 24.3% 25.1% 25.9% 26.4% 27.1% 27.7%<br />
EBIT 16.9% 14.1% 15.8% 16.7% 17.9% 18.5% 19.2% 19.8%<br />
Net 10.5% 9.7% 9.6% 10.8% 11.7% 12.2% 12.7% 13.1%<br />
PROFITABILITY<br />
2008 2009 2010 2011e 2012e 2013e 2014e 2015e<br />
RoE 10.6% 7.9% 7.9% 9.3% 10.0% 9.9% 9.9% 9.9%<br />
RoA 7.5% 7.5% 7.7% 5.9% 6.6% 6.9% 7.3% 7.6%<br />
RoCE 10.7% 10.1% 10.5% 7.8% 8.6% 9.0% 9.5% 10.0%<br />
CAPITAL STRUCTURE<br />
2008 2009 2010 2011e 2012e 2013e 2014e 2015e<br />
Equity ratio 50.6% 57.3% 54.8% 58.0% 61.0% 65.0% 69.0% 72.7%<br />
Gearing 34.1% 27.1% 30.0% 27.3% 23.0% 14.9% 8.6% 2.4%<br />
Average interest 6.2% 4.5% 3.3% 3.4% 3.5% 4.9% 7.5% 23.8%<br />
Asset turnover 0.5 0.5 0.5 0.5 0.5 0.5 0.5 0.5<br />
Net working capital / sales 98.6% 118.5% 133.7% 122.2% 122.7% 121.5% 121.6% 121.7%<br />
Receivables days outstanding 202 233 264 245 245 243 243 244<br />
Payables days outstanding 44 33 40 43 43 43 43 43<br />
VALUATION<br />
2008 2009 2010 2011e 2012e 2013e 2014e 2015e<br />
Share price 6.0 11.6 17.1 17.4 17.4 17.4 17.4 17.4<br />
x No of shares 4.3 4.3 4.4 4.3 4.3 4.3 4.3 4.3<br />
= Market Cap 25.9 49.4 74.9 75.4 75.4 75.4 75.4 75.4<br />
+ Net debt 25.8 22.0 26.5 26.4 24.6 17.5 11.1 3.4<br />
+ LT provisions 1.8 1.8 1.9 2.2 2.4 2.5 2.7 2.8<br />
+ Minorities 1.2 0.8 0.8 0.8 0.8 0.8 0.8 0.8<br />
- Participations 0.0 0.0 0.0 0.0 0.0 0.0 0.0 1.0<br />
=Enterprise Value 54.7 73.9 104.0 104.7 103.1 96.2 90.0 81.4<br />
EV / Sales 0.8 1.3 1.6 1.4 1.3 1.1 1.0 0.8<br />
EV / EBITDA 2.9 4.9 5.9 5.0 4.4 3.8 3.3 2.7<br />
EV / EBIT 4.2 8.0 9.1 7.6 6.3 5.4 4.6 3.8<br />
PE 3.4 7.6 10.6 8.5 7.1 6.5 5.9 5.3<br />
Dividend yield 2.5% 1.3% 1.2% 1.2% 1.3% 1.3% 1.4% 1.5%<br />
- 39 -