MATELAN Research - ISRA VISION AG
MATELAN Research - ISRA VISION AG
MATELAN Research - ISRA VISION AG

You also want an ePaper? Increase the reach of your titles
YUMPU automatically turns print PDFs into web optimized ePapers that Google loves.
<strong>ISRA</strong> <strong>VISION</strong> In-Depth Report<br />
Mid-term growth targets<br />
reiterated<br />
Higher estimates but not<br />
less conservative<br />
Acquisitions still in the<br />
pipeline<br />
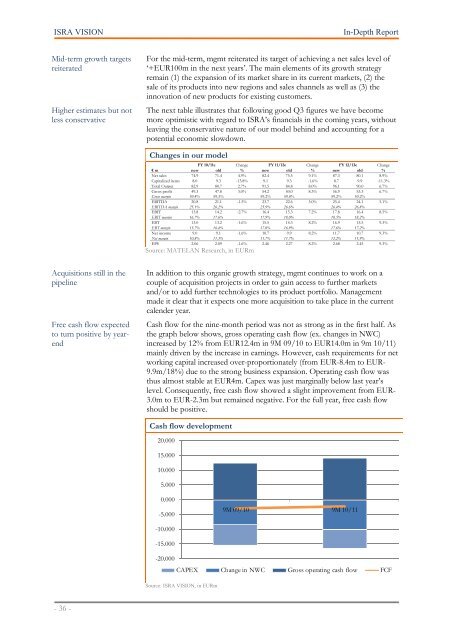
Free cash flow expected<br />
to turn positive by yearend<br />
- 36 -<br />
For the mid-term, mgmt reiterated its target of achieving a net sales level of<br />
‘+EUR100m in the next years’. The main elements of its growth strategy<br />
remain (1) the expansion of its market share in its current markets, (2) the<br />
sale of its products into new regions and sales channels as well as (3) the<br />
innovation of new products for existing customers.<br />
The next table illustrates that following good Q3 figures we have become<br />
more optimistic with regard to <strong>ISRA</strong>’s financials in the coming years, without<br />
leaving the conservative nature of our model behind and accounting for a<br />
potential economic slowdown.<br />
Changes in our model<br />
FY 10/11e Change FY 11/12e Change FY 12/13e Change<br />
€ m new old % new old % new old %<br />
Net sales 74.9 71.4 4.9% 82.4 75.5 9.1% 87.3 80.1 8.9%<br />
Capitalized items 8.0 9.3 -13.8% 9.1 9.3 -1.6% 8.7 9.9 -11.3%<br />
Total Output 82.9 80.7 2.7% 91.5 84.8 8.0% 96.1 90.0 6.7%<br />
Gross profit 49.3 47.8 3.0% 54.2 50.0 8.3% 56.9 53.3 6.7%<br />
Gross margin 59.4% 59.3% 59.2% 59.0% 59.2% 59.2%<br />
EBITDA 20.8 21.1 -1.5% 23.7 22.6 5.0% 25.4 24.1 5.1%<br />
EBITDA margin 25.1% 26.2% 25.9% 26.6% 26.4% 26.8%<br />
EBIT 13.8 14.2 -2.7% 16.4 15.3 7.2% 17.8 16.4 8.5%<br />
EBIT margin 16.7% 17.6% 17.9% 18.0% 18.5% 18.2%<br />
EBT 13.0 13.2 -1.6% 15.5 14.3 8.2% 16.9 15.5 9.3%<br />
EBT margin 15.7% 16.4% 17.0% 16.9% 17.6% 17.2%<br />
Net income 9.0 9.1 -1.6% 10.7 9.9 8.2% 11.7 10.7 9.3%<br />
Net margin 10.8% 11.3% 11.7% 11.7% 12.2% 11.9%<br />
EPS 2.06 2.09 -1.6% 2.46 2.27 8.2% 2.68 2.45 9.3%<br />
Source: <strong>MATELAN</strong> <strong>Research</strong>, in EURm<br />
In addition to this organic growth strategy, mgmt continues to work on a<br />
couple of acquisition projects in order to gain access to further markets<br />
and/or to add further technologies to its product portfolio. Management<br />
made it clear that it expects one more acquisition to take place in the current<br />
calender year.<br />
Cash flow for the nine-month period was not as strong as in the first half. As<br />
the graph below shows, gross operating cash flow (ex. changes in NWC)<br />
increased by 12% from EUR12.4m in 9M 09/10 to EUR14.0m in 9m 10/11)<br />
mainly driven by the increase in earnings. However, cash requirements for net<br />
working capital increased over-proportionately (from EUR-8.4m to EUR-<br />
9.9m/18%) due to the strong business expansion. Operating cash flow was<br />
thus almost stable at EUR4m. Capex was just marginally below last year’s<br />
level. Consequently, free cash flow showed a slight improvement from EUR-<br />
3.0m to EUR-2.3m but remained negative. For the full year, free cash flow<br />
should be positive.<br />
Cash flow development<br />
20.000<br />
15.000<br />
10.000<br />
5.000<br />
0.000<br />
-5.000<br />
-10.000<br />
-15.000<br />
-20.000<br />
Source: <strong>ISRA</strong> <strong>VISION</strong>, in EURm<br />
9M 09/10 9M 10/11<br />
CAPEX Change in NWC Gross operating cash flow FCF