MATELAN Research - ISRA VISION AG
MATELAN Research - ISRA VISION AG
MATELAN Research - ISRA VISION AG

You also want an ePaper? Increase the reach of your titles
YUMPU automatically turns print PDFs into web optimized ePapers that Google loves.
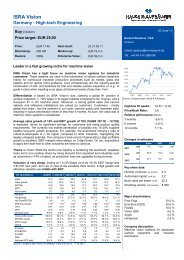
<strong>ISRA</strong> <strong>VISION</strong> In-Depth Report<br />
VALUATION<br />
DCF and peer group<br />
valuation<br />
Three stage DCF model<br />
Conservative long-term<br />
assumptions for growth,<br />
margins …<br />
… and WACC<br />
calculation<br />
Fair value of EUR23.6<br />
- 5 -<br />
For valuation purposes, we use a detailed DCF model and a peer group<br />
comparison based on the most important valuation multiples. While the DCF<br />
model is our main valuation tool, which allows for an in-depth discussion of<br />
<strong>ISRA</strong>’s most important value drivers, the peer group comparison is used as a<br />
validity check for our results.<br />
Our DCF model calculates <strong>ISRA</strong>’s fair value by discounting the company’s<br />
future free cash flows. In the first phase, we derive the free cash flows from<br />
our detailed financial modelling, which is discussed in the financial section of<br />
this report. The cash flows are then estimated via linearization of all<br />
important value drivers to a normalized value. From the latter, the terminal<br />
value is calculated.<br />
As the terminal value assumptions in particular have a large impact on the<br />
valuation, we have kept them conservative: We have, for example, set the<br />
growth rate of total output to 1.5%, which is merely reflecting inflation. We<br />
thus assume no real growth in <strong>ISRA</strong>’s total output in the terminal value. To<br />
underline this, we have equated the depreciation rate with the rate of<br />
investment, meaning that the company is only replacing its capital invested in<br />
the business and not expanding it. In addition, we have set the EBITDA<br />
margin slightly below its value in the last explicitly estimated period (i.e.<br />
2014/15). Moreover, we have not assumed any further improvements in<br />
<strong>ISRA</strong>’s working capital in the terminal value.<br />
All free cash-flows are discounted with the company’s weighted average cost<br />
of capital. This is based on the current forward rates of German government<br />
bonds as risk-free rates. To determine the cost of debt, we add the credit<br />
spread and adjust the tax shield. On the equity side, we add a market risk<br />
premium, which is weighted with a beta factor. In order to reflect current<br />
uncertainties with regard to the economic development in 2012, which is<br />
documented in the recent sell-off on equity markets, we have raised the<br />
market risk premium for small caps by 1pp to now 7%. The beta factor is<br />
derived fundamentally, taking into account the company’s risk profile as<br />
summarized below. In the case of <strong>ISRA</strong>, we see a higher risk compared to the<br />
market in all risk categories, which results in a final beta factor of 1.2.<br />
Weighting the cost of equity and debt with the market values of the<br />
company’s equity and debt, we come to WACCs between 7.5% and 11.4%<br />
for the years under review.<br />
All assumptions of our valuation are detailed in the table below and result in a<br />
fair value of EUR23.6, which provides the share with an upside of roughly<br />
35% to the current price. It should be highlighted that under the same set of<br />
assumptions our fair value would come to EUR26.5 if we had not raised the<br />
market risk premium. This represents an additional upside if equity markets<br />
start to normalise and <strong>ISRA</strong> delivers on the expected earnings streams.