MATELAN Research - ISRA VISION AG
MATELAN Research - ISRA VISION AG
MATELAN Research - ISRA VISION AG

Create successful ePaper yourself
Turn your PDF publications into a flip-book with our unique Google optimized e-Paper software.
<strong>ISRA</strong> <strong>VISION</strong> In-Depth Report<br />
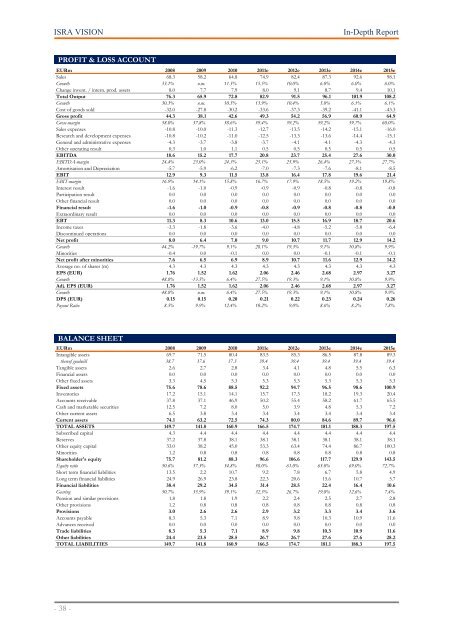
PROFIT & LOSS ACCOUNT<br />
EURm 2008 2009 2010 2011e 2012e 2013e 2014e 2015e<br />
Sales 68.3 58.2 64.8 74.9 82.4 87.3 92.6 98.1<br />
Growth 33.1% n.m. 11.5% 15.5% 10.0% 6.0% 6.0% 6.0%<br />
Change invent. / intern. prod. assets 8.0 7.7 7.9 8.0 9.1 8.7 9.4 10.1<br />
Total Output 76.3 65.9 72.8 82.9 91.5 96.1 101.9 108.2<br />
Growth 30.3% n.m. 10.5% 13.9% 10.4% 5.0% 6.1% 6.1%<br />
Cost of goods sold -32.0 -27.8 -30.2 -33.6 -37.3 -39.2 -41.1 -43.3<br />
Gross profit 44.3 38.1 42.6 49.3 54.2 56.9 60.9 64.9<br />
Gross-margin 58.0% 57.8% 58.6% 59.4% 59.2% 59.2% 59.7% 60.0%<br />
Sales expenses -10.8 -10.0 -11.3 -12.7 -13.5 -14.2 -15.1 -16.0<br />
<strong>Research</strong> and development expenses -10.8 -10.2 -11.0 -12.5 -13.3 -13.6 -14.4 -15.1<br />
General and administrative expenses -4.3 -3.7 -3.8 -3.7 -4.1 -4.1 -4.3 -4.3<br />
Other operating result 0.3 1.0 1.1 0.5 0.5 0.5 0.5 0.5<br />
EBITDA 18.6 15.2 17.7 20.8 23.7 25.4 27.6 30.0<br />
EBITDA-margin 24.4% 23.0% 24.3% 25.1% 25.9% 26.4% 27.1% 27.7%<br />
Amortisation and Depreciation -5.7 -5.9 -6.2 -7.0 -7.3 -7.6 -8.1 -8.5<br />
EBIT 12.9 9.3 11.5 13.8 16.4 17.8 19.6 21.4<br />
EBIT-margin 16.9% 14.1% 15.8% 16.7% 17.9% 18.5% 19.2% 19.8%<br />
Interest result -1.6 -1.0 -0.9 -0.9 -0.9 -0.8 -0.8 -0.8<br />
Participation result 0.0 0.0 0.0 0.0 0.0 0.0 0.0 0.0<br />
Other financial result 0.0 0.0 0.0 0.0 0.0 0.0 0.0 0.0<br />
Financial result -1.6 -1.0 -0.9 -0.8 -0.9 -0.8 -0.8 -0.8<br />
Extraordinary result 0.0 0.0 0.0 0.0 0.0 0.0 0.0 0.0<br />
EBT 11.3 8.3 10.6 13.0 15.5 16.9 18.7 20.6<br />
Income taxes -3.3 -1.8 -3.6 -4.0 -4.8 -5.2 -5.8 -6.4<br />
Discontinued operations 0.0 0.0 0.0 0.0 0.0 0.0 0.0 0.0<br />
Net profit 8.0 6.4 7.0 9.0 10.7 11.7 12.9 14.2<br />
Growth 44.2% -19.7% 9.1% 28.1% 19.3% 9.1% 10.8% 9.9%<br />
Minorities -0.4 0.0 -0.1 0.0 0.0 -0.1 -0.1 -0.1<br />
Net profit after minorities 7.6 6.5 6.9 8.9 10.7 11.6 12.9 14.2<br />
Average no. of shares (m) 4.3 4.3 4.3 4.3 4.3 4.3 4.3 4.3<br />
EPS (EUR) 1.76 1.52 1.62 2.06 2.46 2.68 2.97 3.27<br />
Growth 48.8% -13.5% 6.4% 27.5% 19.3% 9.1% 10.8% 9.9%<br />
Adj. EPS (EUR) 1.76 1.52 1.62 2.06 2.46 2.68 2.97 3.27<br />
Growth 48.8% n.m. 6.4% 27.5% 19.3% 9.1% 10.8% 9.9%<br />
DPS (EUR) 0.15 0.15 0.20 0.21 0.22 0.23 0.24 0.26<br />
Payout Ratio 8.5% 9.9% 12.4% 10.2% 9.0% 8.6% 8.2% 7.8%<br />
BALANCE SHEET<br />
0001<br />
EURm 2008 2009 2010 2011e 2012e 2013e 2014e 2015e<br />
Intangible assets 69.7 71.5 80.4 83.5 85.3 86.5 87.8 89.3<br />
thereof goodwill 38.7 37.6 37.3 39.4 39.4 39.4 39.4 39.4<br />
Tangible assets 2.6 2.7 2.8 3.4 4.1 4.8 5.5 6.3<br />
Financial assets 0.0 0.0 0.0 0.0 0.0 0.0 0.0 0.0<br />
Other fixed assets 3.3 4.5 5.3 5.3 5.3 5.3 5.3 5.3<br />
Fixed assets 75.6 78.6 88.5 92.2 94.7 96.5 98.6 100.9<br />
Inventories 17.2 15.1 14.1 15.7 17.3 18.2 19.3 20.4<br />
Accounts receivable 37.8 37.1 46.9 50.2 55.4 58.2 61.7 65.5<br />
Cash and marketable securities 12.5 7.2 8.0 5.0 3.9 4.8 5.3 7.2<br />
Other current assets 6.5 3.8 3.4 3.4 3.4 3.4 3.4 3.4<br />
Current assets 74.1 63.2 72.5 74.3 80.0 84.6 89.7 96.6<br />
TOTAL ASSETS 149.7 141.8 160.9 166.5 174.7 181.1 188.3 197.5<br />
Subscribed capital 4.3 4.4 4.4 4.4 4.4 4.4 4.4 4.4<br />
Reserves 37.2 37.8 38.1 38.1 38.1 38.1 38.1 38.1<br />
Other equity capital 33.0 38.2 45.0 53.3 63.4 74.4 86.7 100.3<br />
Minorities 1.2 0.8 0.8 0.8 0.8 0.8 0.8 0.8<br />
Shareholder's equity 75.7 81.2 88.3 96.6 106.6 117.7 129.9 143.5<br />
Equity ratio 50.6% 57.3% 54.8% 58.0% 61.0% 65.0% 69.0% 72.7%<br />
Short term financial liabilities 13.5 2.2 10.7 9.2 7.8 6.7 5.8 4.9<br />
Long term financial liabilities 24.9 26.9 23.8 22.3 20.6 15.6 10.7 5.7<br />
Financial liabilities 38.4 29.2 34.5 31.4 28.5 22.4 16.4 10.6<br />
Gearing 50.7% 35.9% 39.1% 32.5% 26.7% 19.0% 12.6% 7.4%<br />
Pension and similar provisions 1.8 1.8 1.9 2.2 2.4 2.5 2.7 2.8<br />
Other provisions 1.2 0.8 0.8 0.8 0.8 0.8 0.8 0.8<br />
Provisions 3.0 2.6 2.6 2.9 3.2 3.3 3.4 3.6<br />
Accounts payable 8.3 5.3 7.1 8.9 9.8 10.3 10.9 11.6<br />
Advances received 0.0 0.0 0.0 0.0 0.0 0.0 0.0 0.0<br />
Trade liabilities 8.3 5.3 7.1 8.9 9.8 10.3 10.9 11.6<br />
Other liabilities 24.4 23.5 28.5 26.7 26.7 27.6 27.6 28.2<br />
TOTAL LIABILITIES 149.7 141.8 160.9 166.5 174.7 181.1 188.3 197.5<br />
- 38 -