MATELAN Research - ISRA VISION AG
MATELAN Research - ISRA VISION AG
MATELAN Research - ISRA VISION AG

Create successful ePaper yourself
Turn your PDF publications into a flip-book with our unique Google optimized e-Paper software.
<strong>ISRA</strong> <strong>VISION</strong> In-Depth Report<br />
Economic recovery has<br />
driven the machine<br />
vision market<br />
Asian markets lead<br />
global economic<br />
recovery, Germany<br />
shines in Europe<br />
- 11 -<br />
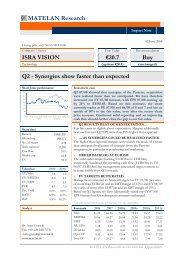
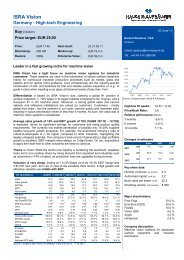
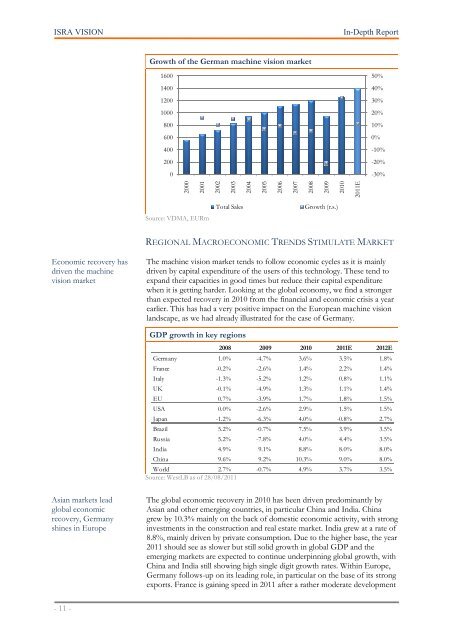
Growth of the German machine vision market<br />
1600<br />
1400<br />
1200<br />
1000<br />
800<br />
600<br />
400<br />
200<br />
0<br />
2000<br />
2001<br />
Source: VDMA, EURm<br />
2002<br />
2003<br />
2004<br />
2005<br />
-10%<br />
-20%<br />
-30%<br />
REGIONAL MACROECONOMIC TRENDS STIMULATE MARKET<br />
The machine vision market tends to follow economic cycles as it is mainly<br />
driven by capital expenditure of the users of this technology. These tend to<br />
expand their capacities in good times but reduce their capital expenditure<br />
when it is getting harder. Looking at the global economy, we find a stronger<br />
than expected recovery in 2010 from the financial and economic crisis a year<br />
earlier. This has had a very positive impact on the European machine vision<br />
landscape, as we had already illustrated for the case of Germany.<br />
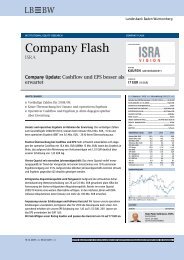
GDP growth in key regions<br />
2008 2009 2010 2011E 2012E<br />
Germany 1.0% -4.7% 3.6% 3.5% 1.8%<br />
France -0.2% -2.6% 1.4% 2.2% 1.4%<br />
Italy -1.3% -5.2% 1.2% 0.8% 1.1%<br />
UK -0.1% -4.9% 1.3% 1.1% 1.4%<br />
EU 0.7% -3.9% 1.7% 1.8% 1.5%<br />
USA 0.0% -2.6% 2.9% 1.5% 1.5%<br />
Japan -1.2% -6.3% 4.0% -0.8% 2.7%<br />
Brazil 5.2% -0.7% 7.5% 3.9% 3.5%<br />
Russia 5.2% -7.8% 4.0% 4.4% 3.5%<br />
India 4.9% 9.1% 8.8% 8.0% 8.0%<br />
China 9.6% 9.2% 10.3% 9.0% 8.0%<br />
World 2.7% -0.7% 4.9% 3.7% 3.5%<br />
Source: WestLB as of 28/08/2011<br />
The global economic recovery in 2010 has been driven predominantly by<br />
Asian and other emerging countries, in particular China and India. China<br />
grew by 10.3% mainly on the back of domestic economic activity, with strong<br />
investments in the construction and real estate market. India grew at a rate of<br />
8.8%, mainly driven by private consumption. Due to the higher base, the year<br />
2011 should see as slower but still solid growth in global GDP and the<br />
emerging markets are expected to continue underpinning global growth, with<br />
China and India still showing high single digit growth rates. Within Europe,<br />
Germany follows-up on its leading role, in particular on the base of its strong<br />
exports. France is gaining speed in 2011 after a rather moderate development<br />
2006<br />
2007<br />
2008<br />
2009<br />
Total Sales Growth (r.s.)<br />
2010<br />
2011E<br />
50%<br />
40%<br />
30%<br />
20%<br />
10%<br />
0%