MATELAN Research - ISRA VISION AG
MATELAN Research - ISRA VISION AG
MATELAN Research - ISRA VISION AG

You also want an ePaper? Increase the reach of your titles
YUMPU automatically turns print PDFs into web optimized ePapers that Google loves.
<strong>ISRA</strong> <strong>VISION</strong> In-Depth Report<br />
Strong discount on PE<br />
basis<br />
Peer group supports our<br />
DCF valuation<br />
Elexis transaction shows<br />
that our valuation is still<br />
not stretched<br />
Peers point at additional<br />
upside for <strong>ISRA</strong><br />
Risks to our valuation<br />
- 9 -<br />
Based on EV/Sales multiples, <strong>ISRA</strong> trades with a sizable premium compared<br />
to its peers. More importantly, <strong>ISRA</strong> trades at a material discount to its peers,<br />
even the close ones, on almost all earnings multiples.<br />
We also find that the peer group analysis is perfectly consistent with our DCF<br />
calculation. Looking at the multiples that are implied in our DCF valuation,<br />
we find that our DCF calculation brings EV / EBITDA and EV/EBIT<br />
multiples roughly in line with the industry average and PEs even in line with<br />
the close peers.<br />
It must also be highlighted that <strong>ISRA</strong> is currently trading substantially below<br />
the transaction multiples that result from the current offer for Elexis.<br />
Furthermore, even our DCF valuation arrives at multiples that are not yet<br />
aligned with the Elexis offer, in particular on a PE basis. It should be kept in<br />
mind that the Elexis offer took place before the recent sell-off in the equity<br />
markets and is thus unaffected by the increased risk in the global economic<br />
situation. However, even our DCF valuation of <strong>ISRA</strong> before the risk<br />
adjustment would yield PE multiples 14.8% and 9.8% below the respective<br />
Elexis multiples for the years 2011 and 2012.<br />
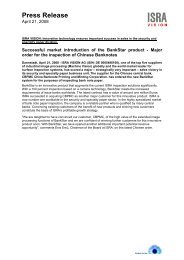
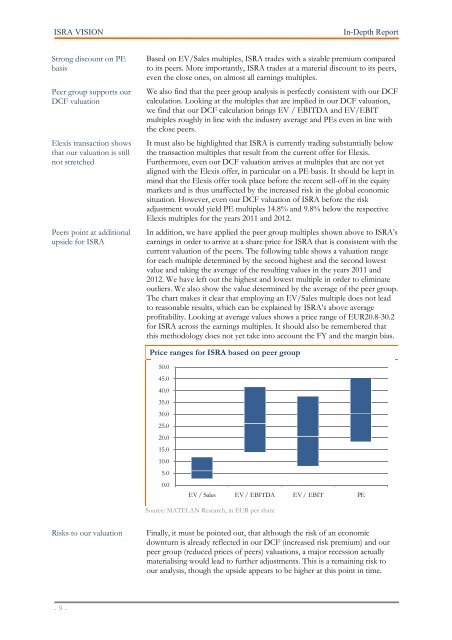
In addition, we have applied the peer group multiples shown above to <strong>ISRA</strong>’s<br />
earnings in order to arrive at a share price for <strong>ISRA</strong> that is consistent with the<br />
current valuation of the peers. The following table shows a valuation range<br />
for each multiple determined by the second highest and the second lowest<br />
value and taking the average of the resulting values in the years 2011 and<br />
2012. We have left out the highest and lowest multiple in order to eliminate<br />
outliers. We also show the value determined by the average of the peer group.<br />
The chart makes it clear that employing an EV/Sales multiple does not lead<br />
to reasonable results, which can be explained by <strong>ISRA</strong>’s above average<br />
profitability. Looking at average values shows a price range of EUR20.8-30.2<br />
for <strong>ISRA</strong> across the earnings multiples. It should also be remembered that<br />
this methodology does not yet take into account the FY and the margin bias.<br />
Price ranges for <strong>ISRA</strong> based on peer group<br />
50.0<br />
45.0<br />
40.0<br />
35.0<br />
30.0<br />
25.0<br />
20.0<br />
15.0<br />
10.0<br />
5.0<br />
0.0<br />
EV / Sales EV / EBITDA EV / EBIT PE<br />
Source: <strong>MATELAN</strong> <strong>Research</strong>, in EUR per share<br />
Finally, it must be pointed out, that although the risk of an economic<br />
downturn is already reflected in our DCF (increased risk premium) and our<br />
peer group (reduced prices of peers) valuations, a major recession actually<br />
materialising would lead to further adjustments. This is a remaining risk to<br />
our analysis, though the upside appears to be higher at this point in time.