MATELAN Research - ISRA VISION AG
MATELAN Research - ISRA VISION AG
MATELAN Research - ISRA VISION AG

You also want an ePaper? Increase the reach of your titles
YUMPU automatically turns print PDFs into web optimized ePapers that Google loves.
<strong>ISRA</strong> <strong>VISION</strong> In-Depth Report<br />
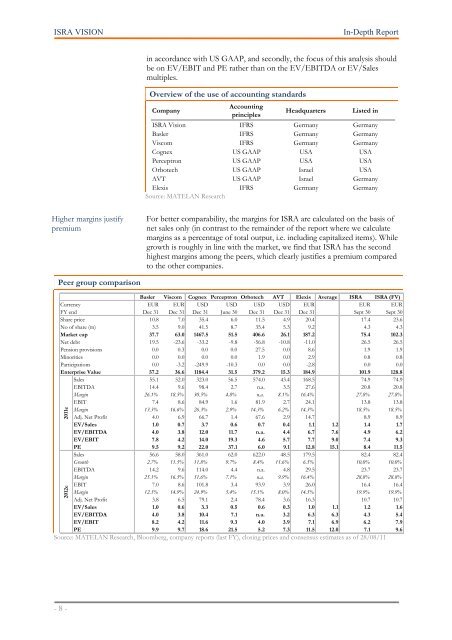
Higher margins justify<br />
premium<br />
Peer group comparison<br />
- 8 -<br />
in accordance with US GAAP, and secondly, the focus of this analysis should<br />
be on EV/EBIT and PE rather than on the EV/EBITDA or EV/Sales<br />
multiples.<br />
Overview of the use of accounting standards<br />
Company<br />
Accounting<br />
principles<br />
Headquarters Listed in<br />
<strong>ISRA</strong> Vision IFRS Germany Germany<br />
Basler IFRS Germany Germany<br />
Viscom IFRS Germany Germany<br />
Cognex US GAAP USA USA<br />
Perceptron US GAAP USA USA<br />
Orbotech US GAAP Israel USA<br />
AVT US GAAP Israel Germany<br />
Elexis<br />
Source: <strong>MATELAN</strong> <strong>Research</strong><br />
IFRS Germany Germany<br />
For better comparability, the margins for <strong>ISRA</strong> are calculated on the basis of<br />
net sales only (in contrast to the remainder of the report where we calculate<br />
margins as a percentage of total output, i.e. including capitalized items). While<br />
growth is roughly in line with the market, we find that <strong>ISRA</strong> has the second<br />
highest margins among the peers, which clearly justifies a premium compared<br />
to the other companies.<br />
Basler Viscom Cognex Perceptron Orbotech AVT Elexis Average <strong>ISRA</strong> <strong>ISRA</strong> (FV)<br />
Currency EUR EUR USD USD USD USD EUR EUR EUR<br />
FY end Dec 31 Dec 31 Dec 31 June 30 Dec 31 Dec 31 Dec 31 Sept 30 Sept 30<br />
Share price 10.8 7.0 35.4 6.0 11.5 4.9 20.4 17.4 23.6<br />
No of share (m) 3.5 9.0 41.5 8.7 35.4 5.3 9.2 4.3 4.3<br />
Market cap 37.7 63.0 1467.5 51.5 406.6 26.1 187.2 75.4 102.3<br />
Net debt 19.5 -23.6 -33.2 -9.8 -56.8 -10.8 -11.0 26.5 26.5<br />
Pension provisions 0.0 0.3 0.0 0.0 27.5 0.0 8.6 1.9 1.9<br />
Minorities 0.0 0.0 0.0 0.0 1.9 0.0 2.9 0.8 0.8<br />
Participations 0.0 -3.2 -249.9 -10.3 0.0 0.0 -2.8 0.0 0.0<br />
Enterprise Value 57.2 36.6 1184.4 31.5 379.2 15.3 184.9 101.9 128.8<br />
Sales 55.1 52.0 323.0 56.5 574.0 43.4 168.5 74.9 74.9<br />
EBITDA 14.4 9.6 98.4 2.7 n.a. 3.5 27.6 20.8 20.8<br />
Margin 26.1% 18.5% 30.5% 4.8% n.a. 8.1% 16.4% 27.8% 27.8%<br />
EBIT 7.4 8.6 84.9 1.6 81.9 2.7 24.1 13.8 13.8<br />
Margin 13.3% 16.6% 26.3% 2.9% 14.3% 6.2% 14.3% 18.5% 18.5%<br />
Adj. Net Profit 4.0 6.9 66.7 1.4 67.6 2.9 14.7 8.9 8.9<br />
EV/Sales 1.0 0.7 3.7 0.6 0.7 0.4 1.1 1.2 1.4 1.7<br />
EV/EBITDA 4.0 3.8 12.0 11.7 n.a. 4.4 6.7 7.6 4.9 6.2<br />
EV/EBIT 7.8 4.2 14.0 19.3 4.6 5.7 7.7 9.0 7.4 9.3<br />
PE 9.5 9.2 22.0 37.1 6.0 9.1 12.8 15.1 8.4 11.5<br />
Sales 56.6 58.0 361.0 62.0 622.0 48.5 179.5 82.4 82.4<br />
Growth 2.7% 11.5% 11.8% 9.7% 8.4% 11.6% 6.5% 10.0% 10.0%<br />
EBITDA 14.2 9.6 114.0 4.4 n.a. 4.8 29.5 23.7 23.7<br />
Margin 25.1% 16.5% 31.6% 7.1% n.a. 9.9% 16.4% 28.8% 28.8%<br />
EBIT 7.0 8.6 101.8 3.4 93.9 3.9 26.0 16.4 16.4<br />
Margin 12.3% 14.9% 24.9% 5.4% 15.1% 8.0% 14.5% 19.9% 19.9%<br />
Adj. Net Profit 3.8 6.5 79.1 2.4 78.4 3.6 16.3 10.7 10.7<br />
EV/Sales 1.0 0.6 3.3 0.5 0.6 0.3 1.0 1.1 1.2 1.6<br />
EV/EBITDA 4.0 3.8 10.4 7.1 n.a. 3.2 6.3 6.3 4.3 5.4<br />
EV/EBIT 8.2 4.2 11.6 9.3 4.0 3.9 7.1 6.9 6.2 7.9<br />
PE 9.9 9.7 18.6 21.5 5.2 7.3 11.5 12.0 7.1 9.6<br />
Source: <strong>MATELAN</strong> <strong>Research</strong>, Bloomberg, company reports (last FY), closing prices and consensus estimates as of 28/08/11<br />
2011e<br />
2012e